
Page 73 - MSAM-2-3
P. 73
Materials Science in Additive Manufacturing Additive manufacturing of SiC composite
A B C
D E F
G H I
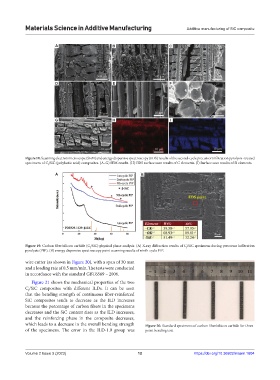
Figure 18. Scanning electron microscope (SEM) and energy dispersive spectroscopy (EDS) results of the second-cycle precursor infiltration pyrolysis -treated
specimens of C /SiC (polylactic acid) composites. (A–G) SEM results. (H) EDS surface scan results of C elements. (I) Surface scan results of Si elements.
f
A B
Figure 19. Carbon fiber/silicon carbide (C /SiC) physical phase analysis. (A) X-ray diffraction results of C /SiC specimens during precursor infiltration
f
f
pyrolysis (PIP). (B) energy dispersive spectroscopy point scanning results of ninth-cycle PIP.
wire cutter (as shown in Figure 20), with a span of 30 mm
and a loading rate of 0.5 mm/min. The tests were conducted
in accordance with the standard GBT6569 – 2006.
Figure 21 shows the mechanical properties of the two
C /SiC composites with different ILDs. It can be seen
f
that the bending strength of continuous fiber-reinforced
SiC composites tends to decrease as the ILD increases
because the percentage of carbon fibers in the specimens
decreases and the SiC content rises as the ILD increases,
and the reinforcing phase in the composite decreases,
which leads to a decrease in the overall bending strength Figure 20. Standard specimens of carbon fiber/silicon carbide for three-
of the specimens. The error in the ILD-1.9 group was point bending test.
Volume 2 Issue 3 (2023) 12 https://doi.org/10.36922/msam.1604