
Page 141 - MSAM-4-3
P. 141
Materials Science in Additive Manufacturing Sunflower-inspired microwave-absorbing metastructure
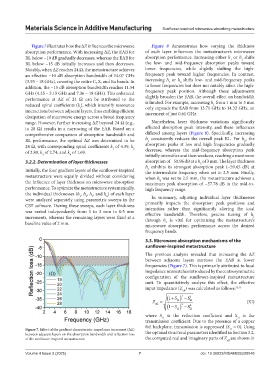
Figure 7 illustrates how the ΔZ influences the microwave Figure 8 demonstrates how varying the thickness
absorption performance. With increasing ΔZ, the EAB for of each layer influences the metastructure’s microwave
RL below −10 dB gradually decreases, whereas the EAB for absorption performance. Increasing either h or h shifts
2
1
RL below −15 dB initially increases and then decreases. the low- and mid-frequency absorption peaks toward
Notably, when ΔZ reaches 24 Ω, the metastructure achieves lower frequencies, while slightly shifting the high-
an effective −10 dB absorption bandwidth of 14.07 GHz frequency peak toward higher frequencies. In contrast,
(3.93 – 18 GHz), covering the entire C, X, and Ku bands. In increasing h or h shifts low- and mid-frequency peaks
3
4
addition, the −15 dB absorption bandwidth reaches 11.54 to lower frequencies but does not notably affect the high-
GHz (4.25 – 5.15 GHz and 7.36 – 18 GHz). This enhanced frequency peak position. Although these adjustments
performance at ΔZ of 24 Ω can be attributed to the slightly broaden the EAB, the overall effect on bandwidth
reduced spiral coefficients (k ), which intensify resonance is limited. For example, increasing h from 1 mm to 3 mm
1
only expands the EAB from 13.71 GHz to 14.32 GHz, an
i
interactions between adjacent layers, thus enabling efficient increment of just 0.61 GHz.
dissipation of microwave energy across a broad frequency
range. However, further increasing ΔZ beyond 24 Ω (e.g., Nonetheless, layer thickness variations significantly
to 28 Ω) results in a narrowing of the EAB. Based on a affected absorption peak intensity, and these influences
comprehensive comparison of absorption bandwidth and differed among layers (Figure 8). Specifically, increasing
RL performance, the optimal ΔZ was determined to be h consistently reduces the overall peak RL. For h , the
1
2
24 Ω, with corresponding spiral coefficients k of 4.39, k absorption peaks at low and high frequencies gradually
1
2
of 2.80, k of 2.74, and k of 1.69. decrease, whereas the mid-frequency absorption peak
initially intensifies and then weakens, reaching a maximum
3
4
3.2.2. Determination of layer thicknesses absorption of −50.96 dB at a h of 3 mm. The layer thickness
2
h exhibits its strongest absorption peak (−59.65 dB) at
3
Initially, the four gradient layers of the sunflower-inspired the intermediate frequency when set to 2.5 mm. Finally,
metastructure were equally divided without considering when h was set to 2.5 mm, the metastructure achieves a
4
the influence of layer thickness on microwave absorption maximum peak absorption of −57.78 dB in the mid-to-
performance. To optimize the metastructure systematically, high frequency range.
the individual thicknesses (h , h , h , and h ) of each layer
2
1
4
3
were analyzed separately using parametric sweeps in the In summary, adjusting individual layer thicknesses
CST software. During these sweeps, each layer thickness primarily impacts the absorption peak positions and
was varied independently from 1 to 3 mm in 0.5 mm intensities rather than significantly altering the total
effective bandwidth. Therefore, precise tuning of h
increments, whereas the remaining layers were fixed at a through h is vital for optimizing the metastructure’s
1
4
baseline value of 2 mm. microwave absorption performance across the desired
frequency bands.
3.3. Microwave absorption mechanisms of the
sunflower-inspired metastructure
The previous analysis revealed that increasing the ΔZ
between adjacent layers narrows the EAB at lower
frequencies (Figure 7). This is primarily attributed to local
impedance mismatches introduced by the centrosymmetric
configuration of the sunflower-inspired metastructure
unit. To quantitatively analyze this effect, the effective
input impedance (Z ) was calculated as follows: 32,33
eff
2
1 S S 2
Z eff 11 2 21 (XI)
1 S S 21
2
11
where S is the reflection coefficient and S is the
21
11
transmission coefficient. Due to the presence of a copper
foil backplane, transmission is suppressed (S = 0). Using
Figure 7. Effect of the gradient characteristic impedance increment (ΔZ) 21
between adjacent layers on the absorption bandwidth and reflection loss the optimal structural parameters identified in Section 3.2,
of the sunflower-inspired metastructure the computed real and imaginary parts of Z are shown in
eff
Volume 4 Issue 3 (2025) 7 doi: 10.36922/MSAM025220048