
Page 139 - MSAM-4-3
P. 139
Materials Science in Additive Manufacturing Sunflower-inspired microwave-absorbing metastructure
To evaluate the microwave absorption performance of different thicknesses over the 2 – 18 GHz frequency range.
the composite, the RL was calculated for the composite As the thickness increases, the minimum RL (absorption
absorber plate of varying thickness as follows: 29 peak) initially decreases and then increases, whereas
the corresponding peak frequency shifts toward lower
Z Z
RL 20log in 0 (II) frequencies. This behavior is consistent with the quarter-
Z Z 0 wavelength (λ/4) matching condition, 30,31 which describes
in
the relationship between matching thickness (d ) and the
2 fd peak matching frequency (f ) as: m
Z Z 0 tanh j c E (III) m
in
d n nc ( n 13 5, ,,...) (IV)
m
where Z , with a value of 377 Ω, is the impedance of free space, 4 f 4 m
0
Z is the input impedance of the material, ε and μ are the where λ is the electromagnetic wavelength in the material.
in
relative complex permittivity and permeability, respectively, f
is the frequency of the incident microwave, d is the thickness Figure 6C demonstrates the experimental relationship
of the absorbing plate, and c, with a value of 3 × 10 m/s, is the between d and f . The red pentagrams denote the
8
m
m
speed of electromagnetic wave in free space. experimental matching points, which align closely with
the theoretical λ/4 curve. This confirms the validity of the
Figure 6A and B present the RL curves and
corresponding 3D plots, respectively, for composites of λ/4 model for the composite. However, the experimental
points lie slightly above the theoretical curve, indicating
that the absorption peaks occur at higher frequencies
than predicted for a given thickness. This deviation is
attributed to the intrinsic absorption properties of the
material, which shift the peak absorption frequency.
Meanwhile, Figure 6D illustrates the EABs (defined
as RL < −10 dB) for thicknesses ranging from 1.5 to
4.0 mm. The widest EAB is achieved at a thickness of
2.0 mm, indicating that the absorption performance of
the composite can be effectively tuned by adjusting the
absorber plate thickness.
3.2. Geometric optimization of the sunflower-
inspired metastructure
3.2.1. Determination of spiral parameters
To achieve broadband microwave absorption, the
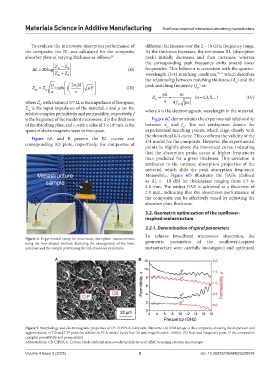
Figure 4. Experimental setup for microwave absorption measurements
using the bow-shaped method, depicting the arrangement of the horn geometric parameters of the sunflower-inspired
antennas and the sample positioning for reflection loss evaluation metastructure were carefully investigated and optimized
A B
Figure 5. Morphology and electromagnetic properties of CB-CIP/PLA composite filaments. (A) SEM image of the composite, showing the dispersion and
agglomeration of CB and CIP particles within the PLA matrix (scale bar: 20 µm; magnification: 1000×). (B) Real and imaginary parts of the composite’s
complex permittivity and permeability
Abbreviations: CB-CIP/PLA: Carbon black-carbonyl iron powder/polylactic acid; SEM: Scanning electron microscopy
Volume 4 Issue 3 (2025) 5 doi: 10.36922/MSAM025220048