
Page 116 - TD-3-3
P. 116
Tumor Discovery E-cadherin and p53 in AEL
2. Case presentation was strongly P53-positive (suggestive of mutated TP53)
(Figure 2C), and IHS in the bone marrow biopsy showed
A 79-year-old male with multiple polypoid tumors E-cadherin-positive staining (Figure 2D and E). All of
at the ascending and transverse colons underwent the following markers were negative: CD3, CD20, CD30,
positron emission tomography-computed tomography. CD79a, LCA, MPO, PSA, S100, AMACR, cytokeratin
Fluorodeoxyglucose-avid lesions were noted at the right (CK)-A/E1/3, CK-CAM5.2, CK7, CK20, and EMA. In
upper lobe of the lungs, prostate, and the thickened urinary addition, the megakaryocyte markers CD42b and CD61
bladder. Prostate biopsy revealed acinar adenocarcinoma
(Gleason score 7) (Figure 1A). Laboratory data were as were negative. To confirm, we stained E-cadherin and P53
10,11
follows: white blood cell count 5500/µL (no abnormal in the prostatic adenocarcinoma, as previously reported.
blasts), hemoglobin 8.8 g/dL, mean corpuscular volume As shown in Figure 1B and C, P53 was sporadically positive
92.0 fL, reticulocytes 14%, platelet count 64,000/µL, serum (compatible with wild-type), unlike in the bone marrow,
C-reactive protein 0.46 mg/dL, lactate dehydrogenase and E-cadherin was positive.
(LDH) 452 U/L (reference 124 – 222), Fe 205 µg/dL Accordingly, the patient was diagnosed with PEL
(reference 40 – 188), and ferritin 494 ng/mL (21 – 282). despite not fulfilling the diagnostic criterion of >80% of
Hepatic and renal functions were within normal limits. He erythroid cells in the bone marrow. The karyotype of bone
1
was initially suspected of having disseminated prostatic marrow aspiration showed 52, X, -Y, inv (1) (p34q21),
adenocarcinoma due to his high level of prostate-specific +add (4) (q21), +6, −11, −13, +14, −16, add (16) (q24), −19,
antigen (PSA) (21.5 ng/mL: reference <4.0); however, +21, +r1, +6 mar [4]/46, XY [1]. Other abnormal clones
examination of his bone marrow showed increased levels (mode 49 = 1, 50 = 3, 51 = 7, 52 = 3, 53 = 1) not fully
of CD45-positive abnormal blasts (32.2% of nucleated cell matched with the above karyotype were also noted. The
count) of small to large sizes, most with one and some with patient was treated with one course of the daunomycin
two nuclei, basophilic vacuolated cytoplasm, and some with (DNR)/Ara-C regimen, followed by one course of the
cytoplasmic blebs. These abnormal blasts tended to occur venetoclax/azacytidine (VEN/AZA) regimen. However,
in clusters (Figure 2A), typical of erythroid hyperplasia. the patient died of infection by an undetermined pathogen
In addition, there were myelodysplastic features in the (serum procalcitonin, 8.24 ng/mL [reference <0.4;
erythroid and myeloid cells but not in megakaryocytes, β-D-glucan, 10.7 pg/mL [reference <20]) at <3 months from
and ringed sideroblasts were noted in 20% of cells.
Quantitative Wilms’ tumor 1 mRNA in bone marrow A B C
was 2.1 × 10 (reference <10 ) while FLT3 (ITD/TKD)
4
2
mutation was negative. Abnormal blasts were negative
for myeloperoxidase (MPO) and only partially positive
for PAS (Figure 2B). In flow cytometry, GPA expression
was negative. Immunohistochemical staining (IHS) of
the abnormal blasts in the bone marrow clot preparation
D E
A B
C
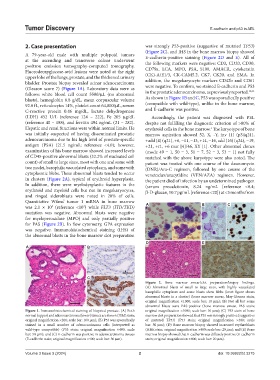
Figure 2. Bone marrow smear/clot preparation/biopsy findings.
(A) Abnormal blasts of small to large sizes, with highly vacuolated
basophilic cytoplasm and some blasts show blebs (inset figure shows
abnormal blasts in a cluster) (bone marrow smear, May-Giemsa stain;
original magnification ×1000; scale bar: 10 µm); (B) Not all but some
abnormal blasts were PAS-positive (bone marrow smear, PAS stain;
Figure 1. Immunohistochemical staining of biopsied prostate. (A) Both original magnification ×1000; scale bar: 10 µm); (C) P53 stain of bone
normal (upper) and adenocarcinoma (lower) tissues are shown (H&E stain; marrow clot preparation showed that P53 was strongly positive (suggestive
original magnification ×200; scale bar: 100 µm); (B) P53 was sporadically of mutated TP53) (P53 stain; original magnification ×400; scale
stained in a small number of adenocarcinoma cells (interpreted as bar: 50 µm); (D) Bone marrow biopsy showed increased erythroblasts
wild-type compatible) (P53 stain; original magnification ×400; scale (H&E stain; original magnification ×400; scale bar: 20 µm); and (E) Bone
bar: 50 µm); and (C) E-cadherin was positive in adenocarcinoma tissues marrow biopsy showed that E-cadherin was diffusely positive (E-cadherin
(E-cadherin stain; original magnification ×400; scale bar: 50 µm). stain; original magnification ×400; scale bar: 20 µm).
Volume 3 Issue 3 (2024) 2 doi: 10.36922/td.3275