
Page 58 - TD-4-3
P. 58
Tumor Discovery Prognostication in palliative cancer care
Table 2. Care trajectory, performance status, biomarkers,
symptom intensities, and days of survival
n Median Range p‑value*
Care trajectory
Ongoing anti-cancer 57 82 3 – 629 <0.01
treatment
Palliative care alone 89 40 6 – 708
Missing 1
ECOG PS 2
1 15 122 19 – 368 ref. category
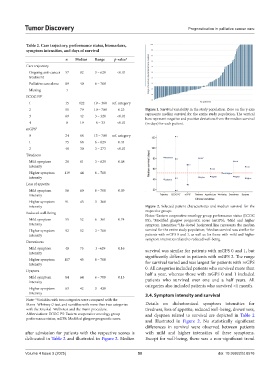
2 55 79 10 – 708 0.23 Figure 1. Survival variability in the study population. Zero on the y-axis
3 69 42 3 – 320 <0.01 represents median survival for the entire study population. The vertical
bars represent negative and positive deviations from the median survival
4 8 19 6 – 33 <0.01 (in days) for each patient.
mGPS 3
0 24 68 13 – 708 ref. category
1 75 68 6 – 629 0.44
2 48 30 3 – 273 <0.01
Tiredness
Mild symptom 28 81 3 – 629 0.08
intensity
Higher symptom 119 44 6 – 708
intensity
Loss of appetite
Mild symptom 56 60 6 – 708 0.09
intensity
Higher symptom 91 45 3 – 368
intensity Figure 2. Selected patient characteristics and median survival for the
Reduced well-being respective groups
Notes: Eastern cooperative oncology group performance status (ECOG
a
Mild symptom 55 52 6 – 361 0.74 PS); Modified glasgow prognostic score (mGPS); Mild and higher
c
b
intensity symptom intensities; The dotted horizontal line represents the median
d
e
Higher symptom 92 52 3 – 708 survival for the entire study population; Median survival was similar for
intensity patients with mGPS 0 and 1, as well as for those with mild and higher
symptom intensities related to reduced well-being.
Drowsiness
Mild symptom 40 75 3 –629 0.16 survival was similar for patients with mGPS 0 and 1, but
intensity
significantly different in patients with mGPS 2. The range
Higher symptom 107 45 6 – 708
intensity for survival varied and was largest for patients with mGPS
Dyspnea 0. All categories included patients who survived more than
half a year, whereas those with mGPS 0 and 1 included
Mild symptom 84 64 6 – 708 0.13 patients who survived over one and a half years. All
intensity
categories also included patients who survived <1 month.
Higher symptom 63 42 3 – 439
intensity 3.4. Symptom intensity and survival
Note: *Variables with two categories were compared with the
Mann–Whitney U test, and variables with more than two categories Details on dichotomized symptom intensities for
with the Kruskal–Wallis test and the Dunn procedure. tiredness, loss of appetite, reduced well-being, drowsiness,
Abbreviations: ECOG PS: Eastern cooperative oncology group and dyspnea related to survival are depicted in Table 2
performance status; mGPS: Modified glasgow prognostic score.
and illustrated in Figure 2. No statistically significant
differences in survival were observed between patients
after admission for patients with the respective scores is with mild and higher intensities of these symptoms.
delineated in Table 2 and illustrated in Figure 2. Median Except for well-being, there was a non-significant trend
Volume 4 Issue 3 (2025) 50 doi: 10.36922/td.8576