
Page 53 - TD-4-3
P. 53
Tumor Discovery HRD genomic alterations in Chinese NSCLC
Appendices
Figure A1. Distribution of gene mutations in the HRD-H and HRD-L groups, showing the distribution of mutation status (mutated/unmutated) of
different genes in patients. X-axis: Group (HRD-H, HRD-L). Y-axis: Gene name (EGFR, TP53). Each point represents a patient, with mutation/unmutated
marked by color.
Abbreviations: HRD-H: Homologous recombination deficiency-high; HRD-L: Homologous recombination deficiency-low.
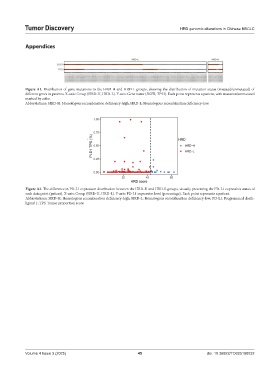
Figure A2. The difference in PD-L1 expression distribution between the HRD-H and HRD-L groups, visually presenting the PD-L1 expression status of
each data point (patient). X-axis: Group (HRD-H, HRD-L). Y-axis: PD-L1 expression level (percentage). Each point represents a patient.
Abbreviations: HRD-H: Homologous recombination deficiency-high; HRD-L: Homologous recombination deficiency-low; PD-L1: Programmed death-
ligand 1; TPS: Tumor proportion score.
Volume 4 Issue 3 (2025) 45 doi: 10.36922/TD025180032