
Page 69 - TD-4-3
P. 69
Tumor Discovery Highly accurate gene panels for cancer screening
either normal (N) or tumor (T). Genes that are only intervals may not be sufficient to be included in the only-
expressed above or below a threshold level for class x are N-below class.
referred to as “only x above” or “only x below,” respectively.
Specifically, we examined the “only-T-above,” “only-T- 2.5. Statistically significant expression
below,” “only-N-above,” and “only-N-below” gene sets. By dysregulations
combining the “above” and “below” within the same class, The significance of dysregulation patterns within the
we obtained the full sets of T-genes and N-genes. Notably, T-only and N-only sample subsets can be assessed using
a single gene may simultaneously belong to both the only- Fisher’s exact test to filter out genes exhibiting such
49
T-above and only-N-below groups. patterns by chance.
2.4. Data digitalization Verifications show that with a p=0.01 and the sample
sizes in Table 1, a dysregulation pattern is significant
We explicitly defined normal and tumor expression
intervals for each gene. In each case, the populated when observed in approximately 5% of normal samples
expression space can be segmented into three regions: (N-only subset) or 10% of tumor samples (T-only subset).
“N-only,” “N-T,” and “T-only” subintervals, which were We applied these thresholds, respectively, across all cancer
associated with the ternary values −1, 0, and 1, respectively. types. This threshold justifies the exclusion of certain genes
from analysis and explains why some genes identified in
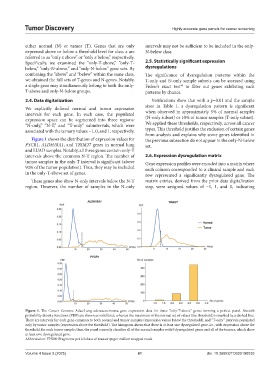
Figure 1 shows the distribution of expression values for the previous subsection do not appear in the only-N-below
PYCR1, ALDH18A1, and TRIM27 genes in normal lung set.
and LUAD samples. Notably, all three genes contain only-T
intervals above the common N-T region. The number of 2.6. Expression dysregulation matrix
tumor samples in the only-T interval is significant (above Gene expression profiles were encoded into a matrix where
90% of the tumor population). Thus, they may be included each column corresponded to a clinical sample and each
in the only-T-above set of genes. row represented a significantly dysregulated gene. The
These genes also show N-only intervals below the N-T matrix entries, derived from the prior data digitalization
region. However, the number of samples in the N-only step, were assigned values of −1, 1, and 0, indicating
Figure 1. The Cancer Genome Atlas-Lung adenocarcinoma gene expression data for three “only-T-above” genes forming a perfect panel. Smooth
probability density functions (PDF) are shown as solid lines, whereas the maximum of the normal set of values (the threshold) is marked by a dashed line.
There are intervals for each gene common to both normal and tumor samples (expression values below the threshold), and “T-only” intervals populated
only by tumor samples (expression above the threshold). The histogram shows that there is at least one dysregulated gene, i.e., with expression above the
threshold, for each tumor sample; thus, the panel correctly classifies all of the normal samples with 0 dysregulated genes and all of the tumors, which show
at least one dysregulated gene.
Abbreviation: FPKM: Fragments per kilobase of transcript per million mapped reads.
Volume 4 Issue 3 (2025) 61 doi: 10.36922/TD025190035