
Page 71 - TD-4-3
P. 71
Tumor Discovery Highly accurate gene panels for cancer screening
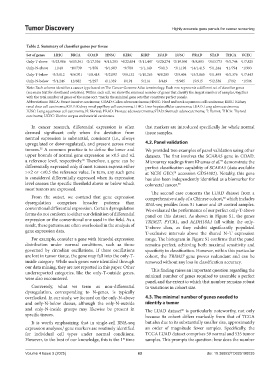
Table 2. Summary of classifier genes per tissue
Set of genes LIHC BRCA COAD HNSC KIRC KIRP LUAD LUSC PRAD STAD THCA UCEC
Only-T-above a 3/23,986 a 6/15,361 a 2/17,536 a 4/13,293 a 4/22,654 a 3/11,447 a 3/20,274 a 2/19,596 a 8/8,093 a 3/13,773 a 5/5,744 a 1/7,825
Only-N-above 11/40 a 10/739 a 1/876 a 8/1,903 a 3/780 a 1/1,140 a 5/613 a 3/1,198 a 14/1,415 a 5/1,244 a 11/794 a 1/993
Only-T-below a 5/3,812 a 6/6,701 a 1/8,418 a 5/2,093 a 3/9,132 a 1/10,263 a 4/8,285 a 2/9,404 a 15/3,865 a 5/1,499 a 6/5,376 a 1/7,443
Only-N-below a 5/1,246 12/682 a 2/297 6/1,339 8/191 5/214 8/449 a 3/985 15/915 a 5/2,536 17/92 a 1/506
Note: Each column identifies a cancer type based on The Cancer Genome Atlas terminology. Each row represents a different set of classifier genes
(see main text for shorthand notation). Within each cell, we show the minimal number of genes that classify the largest number of samples, together
a
with the total number of genes of the same sort. marks the minimal gene sets that constitute perfect panels.
Abbreviations: BRCA: Breast invasive carcinoma; COAD: Colon adenocarcinoma; HNSC: Head and neck squamous cell carcinoma; KIRC: Kidney
renal clear cell carcinoma; KIRP: Kidney renal papillary cell carcinoma; LIHC: Liver hepatocellular carcinoma; LUAD: Lung adenocarcinoma;
LUSC: Lung squamous cell carcinoma; N: Normal; PRAD: Prostate adenocarcinoma; STAD: Stomach adenocarcinoma; T: Tumor; THCA: Thyroid
carcinoma; UCEC: Uterine corpus endometrial carcinoma.
In cancer research, differential expression is often that markers are introduced specifically for whole normal
deemed significant only when the deviation from tissue samples.
normal expression is substantial, consistent (i.e., always
upregulated or downregulated), and present across most 4.2. Panel validation
tumors. A common practice is to define the lower and We provided two examples of panel validation using other
55
upper bounds of normal gene expression as ×0.5 and ×2 datasets. The first involves the SCARA5 gene in COAD.
a reference level, respectively. Therefore, a gene can be Microarray readings from Khamas et al. demonstrate the
56
57
differentially expressed only if most tumors express either perfect classification capability of SCARA5 (data available
>×2 or <×0.5 the reference value. In turn, any such gene at NCBI GEO, accession GDS4382). Notably, this gene
58
is considered differentially expressed when its expression has also been independently identified as a biomarker for
level crosses the specific threshold above or below which colorectal cancer. 59
most tumors are expressed.
The second case concerns the LUAD dataset from a
From the outset, we contend that gene expression comprehensive study of a Chinese cohort, which includes
60
dysregulation comprises broader patterns than RNA-seq profiles from 51 tumor and 49 control samples.
conventional differential expression. Certain dysregulation We evaluated the performance of our perfect only-T-above
forms do not conform to either our definition of differential panel on this dataset. As shown in Figure S1, the genes
expression or the conventional one used in the field. As a TRIM27, PYCR1, and ALDH18A1 fall within the only-
result, these patterns are often overlooked in the analysis of T-above class, as they exhibit significantly populated
gene expression data. T-exclusive intervals above the shared N–T expression
For example, consider a gene with bimodal expression range. The histogram in Figure S1 confirms that the panel
distribution under normal conditions, such as those remains perfect, achieving both maximal sensitivity and
governed by circadian oscillations. If these oscillations specificity in classification. However, within this particular
are lost in tumor tissue, the gene may fall into the only-T- cohort, the TRIM27 gene proves redundant and can be
inside category. While such genes were identified through removed without any loss in classification accuracy.
our data mining, they are not reported in this paper. Other This finding raises an important question regarding the
underreported categories, like the only-T-outside genes,
were also encountered. minimal number of genes required to assemble a perfect
panel, and the extent to which that number remains robust
Conversely, what we term as non-differential to variations in cohort size.
dysregulation, corresponding to N-genes, is typically
overlooked. In our study, we focused on the only-N-above 4.3. The minimal number of genes needed to
and only-N-below classes, although the only-N-outside identify a tumor
and only-N-inside groups may likewise be present in The LUAD dataset is particularly noteworthy, not only
60
specific tissues. because its cohort differs markedly from that of TCGA
It is worth emphasizing that in single-cell RNA-seq but also due to its substantially smaller size, approximately
expression analyses, gene markers are routinely identified an order of magnitude fewer samples. Specifically, the
3
for individual cell types under normal conditions. TCGA LUAD dataset comprises 59 normal and 535 tumor
However, to the best of our knowledge, this is the 1 time samples. This prompts the question: how does the number
st
Volume 4 Issue 3 (2025) 63 doi: 10.36922/TD025190035