
Page 29 - manuscript_ijb05580
P. 29
fluorescence was detected at the bottom of the green-fluorescent C-MTs layer. On day 14 (Figure
8D ii)), significant overlap between red and green fluorescence was observed. These results indicate
that with the extension of culture time, the bone layer represented by EO-MTs and the cartilage
layer represented by C-MTs exhibit gradually enhanced crosstalk, suggesting that the cartilage and
bone layers may eventually achieve functional integration.
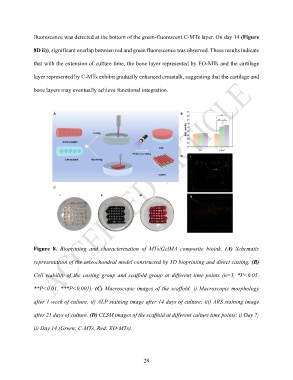
Figure 8. Bioprinting and characterization of MTs/GelMA composite bioink. (A) Schematic
representation of the osteochondral model constructed by 3D bioprinting and direct casting. (B)
Cell viability of the casting group and scaffold group at different time points (n=3, *P<0.05,
**P<0.01, ***P<0.001). (C) Macroscopic images of the scaffold: i) Macroscopic morphology
after 1 week of culture; ii) ALP staining image after 14 days of culture; iii) ARS staining image
after 21 days of culture. (D) CLSM images of the scaffold at different culture time points: i) Day 7;
ii) Day 14 (Green: C-MTs, Red: EO-MTs).
28