
Page 31 - AC-2-2
P. 31
Arts & Communication Identification of Pollock Art
Table 2. Combined Fisher discriminant scores of different image numerical content descriptors and different image transforms
Zernike Chebishev First 4 Multi‑scale Haralick Tamura Radon Fractals
Polynomials Statistics Moments Histograms Textures Textures
Raw pixels 2.94 1.40 2.89 3.11 2.69 0.90 0.44 1.7
Color 3.288 1.05 2.18 2.42 4.58 0.67 0.46 8.9
Hue 1.86 0.48 1.71 1.81 2.42 0.12 0.39 3.43
Fourier 2.29 1.72 2.14 0.64 1.51 0.76 0.65 0.60
Wavelet 3.81 1.23 1.06 3.25 5.42 0.23 0.78 0.06
Chebyshev 0.16 3.52 1.59 2.38 2.7 0.59 0.28 1.06
from different transforms of the paintings. As explained in
section 2.2, a higher Fisher discriminant score means that
the numerical content descriptor can better differentiate
between authentic Jackson Pollock paintings and paintings
by unknown painters who tried to mimic his work.
The table shows that when computing numerical image
content descriptors from the raw pixels of the images,
fractal features are not among the most informative features
that differentiate between authentic and faked Jackson
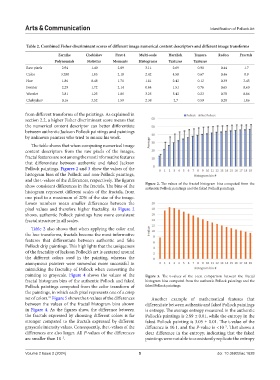
Pollock paintings. Figures 2 and 3 show the values of the
histogram bins of the Pollock and non-Pollock paintings,
and the t-values of the differences, respectively. The figures
show consistent differences in the fractals. The bins of the Figure 2. The values of the fractal histogram bins computed from the
authentic Pollock paintings and the faked Pollock paintings.
histogram represent different scales of the fractals, from
one pixel to a maximum of 20% of the size of the image.
Lower numbers mean smaller differences between the
pixel values and therefore higher fractality. As Figure 2
shows, authentic Pollock paintings have more consistent
fractal structure in all scales.
Table 2 also shows that when applying the color and
the hue transforms, fractals become the most informative
features that differentiate between authentic and fake
Pollock drip paintings. This highlights that the uniqueness
of the fractality of Jackson Pollock’s art is centered around
the different colors used in the painting, whereas the
anonymous painters were somewhat more successful in
mimicking the fractality of Pollock when converting the
painting to grayscale. Figure 4 shows the values of the Figure 3. The t-values of the t-test comparison between the fractal
fractal histogram bins of the authentic Pollock and faked histogram bins computed from the authentic Pollock paintings and the
Pollock paintings computed from the color transform of faked Pollock paintings.
the paintings, in which each pixel represents one of a crisp
set of colors. Figure 5 shows the t-values of the differences Another example of mathematical features that
21
between the values of the fractal histogram bins shown differentiate between authentic and faked Pollock paintings
in Figure 4. As the figures show, the difference between is entropy. The average entropy measured in the authentic
the fractals expressed by choosing different colors is far Pollock’s paintings is 2.89 ± 0.01, while the entropy in the
stronger compared to the fractals expressed by different faked Pollock painting is 3.05 ± 0.01. The t-value of the
grayscale intensity values. Consequently, the t-values of the difference is 10.1, and the P-value is <10 . That shows a
−5
differences are also larger. All P-values of the differences clear difference in the entropy, indicating that the faked
are smaller than 10 . paintings were not able to consistently replicate the entropy
−5
Volume 2 Issue 2 (2024) 5 doi: 10.36922/ac.1628