
Page 32 - AC-2-2
P. 32
Arts & Communication Identification of Pollock Art
shows that the attempts to produce drip paintings similar to
Pollock’s style were successful in mimicking the overall hue
distribution in the paintings. It can also mean that Pollock’s
paintings do not reflect any unique signature style through
the overall hue distribution.
Analysis of textures such as Gabor, Haralick, and Tamura
also shows significant differences between authentic
painting of Jackson Pollock and the faked paintings. The
mean Tamura texture directionality measured from the
35
genuine Pollock paintings is 1.81 ± 0.02, while the same
directionality is 1.49 ± 0.02 when measured from the faked
Pollock paintings. The t-value of the difference is 12.73,
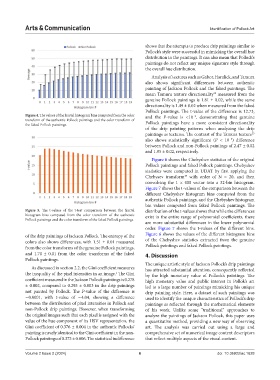
Figure 4. The values of the fractal histogram bins computed from the color and the P-value is <10 , demonstrating that genuine
−5
transform of the authentic Pollock paintings and the color transform of Pollock paintings have a more consistent directionality
the faked Pollock paintings.
of the drip painting patterns when analyzing the drip
35
paintings as textures. The contrast of the Tamura texture
also shows statistically significant (P < 10 ) difference
−5
between Pollock and non-Pollock paintings of 2.47 ± 0.02
and 1.95 ± 0.02, respectively.
Figure 6 shows the Chebyshev statistics of the original
Pollock paintings and faked Pollock paintings. Chebyshev
statistics were computed in UDAT by first applying the
Chebysev transform with order of N = 20, and then
19
convolving the 1 × 400 vector into a 32-bin histogram.
Figure 7 shows the t-values of the comparison between the
different Chebyshev histogram bins computed from the
authentic Pollock paintings, and the Chebyshev histogram
bin values computed from faked Pollock paintings. The
Figure 5. The t-values of the t-test comparison between the fractal distribution of the t-values shows that while the differences
histogram bins computed from the color transform of the authentic exist in the entire range of polynomial coefficients, there
Pollock paintings and the color transform of the faked Pollock paintings.
are more substantial differences in the lower polynomial
order. Figure 7 shows the t-values of the different bins.
of the drip paintings of Jackson Pollock. The entropy of the Figure 6 shows the values of the different histogram bins
colors also shows differences, with 1.51 ± 0.01 measured of the Chebyshev statistics extracted from the genuine
from the color transforms of the genuine Pollock paintings, Pollock paintings and faked Pollock paintings.
and 1.70 ± 0.01 from the color transforms of the faked 4. Discussion
Pollock paintings.
The unique artistic style of Jackson Pollock’s drip paintings
As discussed in section 2.2, the Gini coefficient measures has attracted substantial attention, consequently reflected
the inequality of the pixel intensities in an image. The Gini by the high monetary value of Pollock’s paintings. The
1
coefficient measured in the Jackson Pollock paintings is 0.278 high monetary value and public interest in Pollok’s art
± 0.002, compared to 0.293 ± 0.003 in the drip paintings led to a large number of paintings mimicking his unique
not painted by Pollock. The P-value of the difference is drip painting style. Here, a dataset of such paintings was
∼0.0001, with t-value of ∼4.04, showing a difference used to identify the unique characteristics of Pollock’s drip
between the distribution of pixel intensities in Pollock and paintings as reflected through the mathematical elements
non-Pollock drip paintings. However, when transforming of his work. Unlike some “traditional” approaches to
the original images such that each pixel is assigned with the analyze the paintings of Jackson Pollock, this paper uses
value of the hue component of its HSV representation, the a quantitative method, providing a new way of observing
Gini coefficient of 0.376 ± 0.004 in the authentic Pollocks’ art. The analysis was carried out using a large and
painting is nearly identical to the Gini coefficient in the non- comprehensive set of numerical image content descriptors
Pollock paintings of 0.373 ± 0.006. The statistical indifference that reflect multiple aspects of the visual content.
Volume 2 Issue 2 (2024) 6 doi: 10.36922/ac.1628