
Page 32 - AC-2-3
P. 32
Arts & Communication Cognition and cultural mediation
profile questionnaire, the text for the first two groups,
the painting image, and the list of words in Table 1.
After signing the consent form, participants completed
the questionnaire that had been tailored accordingly.
Participants in Group 1 received semantic priming with
a text containing real information about the artwork.
Participants in all groups then viewed the image
reproduction of Wassily Kandinsky’s painting Composition
IV: Battle for at least 5 min. Subsequently, all participants
completed the answer sheet, selecting the words that best
encapsulated the figurative elements they had observed in
the artwork.
3.4. Data analysis
The participants’ answers were categorized according to the
marked figurative elements. The frequency of the figurative
elements marked by the participants was calculated.
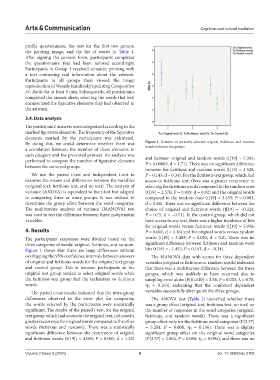
By doing this, we could determine whether there was Figure 1. Relation of correctly selected original, fictitious, and random
a correlation between the number of these elements in words between the groups
each category and the presented primers. An analysis was and between original and random words (t[19] = 5.395;
performed to compare the number of figurative elements P = 0.00003, d = 1.71). There was no significant difference
between the surveyed groups.
between the fictitious and random words (t[19] = 1.528,
We use the paired t-test and independent t-test to P = 0.143, d = 0.34). For the fictitious text group, which had
examine the means and differences between the variables access to fictitious text, there was a greater recurrence in
(original text, fictitious text, and no text). The analysis of selecting the fictitious words compared to the random ones
variance (ANOVA) is equivalent to the t-test but adapted (t[19] = 2.570; P = 0.019, d = 0.92) and the original words
to comparing three or more groups. It was utilized to compared to the random ones (t[19] = 3.455; P = 0.003,
determine the group effect between the word categories. d = 0.86). There was no significant difference between the
The multivariate analysis of variance (MANOVA) test choice of original and fictitious words (t[19] = −0.324,
was used to test the difference between three independent P = 0.75, d = −0.11). In the control group, which did not
variables. have access to any text, there was a higher incidence of hits
for original words versus fictitious words (t[19] = 3.936;
4. Results P = 0.001, d = 1.16) and for original words versus random
The participants’ responses were divided based on the words (t[19] = 3.405; P = 0.003, d = 0.8). There was no
three categories of words: original, fictitious, and random. significant difference between fictitious and random word
Figure 1 shows that there are large differences without hits (t[19] = −1.453, P = 0.163, d = −0.34).
overlapping the 95% confidence intervals between answers The MANOVA data with scores for three dependent
of original and fictitious words for the original text group variables (original vs. fictitious vs. random words) indicated
and control group. This is because participants in the that there was a multivariate difference between the three
original text group tended to select original words while groups, which was unlikely to have occurred due to
the fictitious text group had the inclination to fictitious sampling error alone (F[6],110] = 3.58, P = 0.003, λ = 0.70,
words. η₂ = 0.163), indicating that the combined dependent
The paired t-test results indicated that the intra-group variables successfully distinguish the three groups.
differences observed in the error plot for comparing The ANOVA test (Table 2) identified whether there
the words selected by the participants were statistically was a group effect (original text, fictitious text, no text) on
significant. The results of the paired t-test, for the original the number of responses in the word categories (original,
text group, which had access to the original text, indicated a fictitious, and random words). There was a significant
greater recurrence for original words compared to the other group effect only for the fictitious word categories (F[2.57]
words (fictitious and random). There was a statistically = 5.284, P = 0.008, η₂ = 0.156). There was a slightly
significant difference between the recurrence of original significant group effect on the original word categories
and fictitious words (t[19]) = 4.081; P = 0.001, d = 1.42) (F[2.57] = 2.964, P = 0.060, η₂ = 0.094), and there was no
Volume 2 Issue 3 (2024) 6 doi: 10.36922/ac.2105