
Page 33 - AC-2-3
P. 33
Arts & Communication Cognition and cultural mediation
effect on the random group (F[2.57] = 1.67, P = 0.197, η₂ perception of visual artwork. Moreover, we proposed a
= 0.055). reflection on how mediation instruments can influence the
Given that the dependent variables were not interpretation of specific artwork. During the experimental
significantly correlated (n = 60; r = −0.162, P = 0.215; study, participants were exposed to different semantic
r = 0.217, P = 0.095; r = 0.166, P = 0.206), independent priming or no priming before analyzing an artwork.
t-tests for differences between groups were performed for According to intragroup analyses, significant
each of the dependent variables. To avoid type 1 errors, a differences were observed between the number of original
P > 0.017 (0.05/3) was considered for the statistical test. and fictitious words in the original text group and control
Table 3 presents the results of the independent t-tests, group. Participants who received the original text marked
indicating that there are differences not attributed to more original words, whereas those who received the
sampling error between the original text group and fictitious text tagged more words from original words.
fictitious text group for the number of fictitious words Participants who did not receive any text marked more
(t[38] = −2.478; P = 0.017, d = −0.798) and between the figurative elements of the original text, suggesting that
fictitious text group and control group for the fictitious without prior information, they tended to focus on the
words (t[38] = −2.746; P = 0.009, d = 0.89), but there was figurative elements related to the work. However, if the
no difference between original text group and control text was presented, the recurrence tended to be greater.
group for the fictitious words. There was also no difference Henceforth, we assume that spectators can understand and
among the three groups for the random and original word interpret artwork even without the aid of text. However, the
responses, considering a higher threshold of significance presence of text in mediation enhances this understanding.
(P > 0.017) was imposed. The effect size for the between- It is essential to note that if an unrelated text is presented,
group differences in the fictitious words was larger, viewers will be influenced by this information.
confirming the results of ANOVA. Our results corroborate the findings of Schüler since
20
the fictitious text significantly influenced the perception
5. Discussion of the artwork, and participants understood that this
This research aimed to investigate the extent to which information in the text was real and consistent in relation
the presentation of semantic priming influences the to the artwork. Nevertheless, according to Schüler,
20
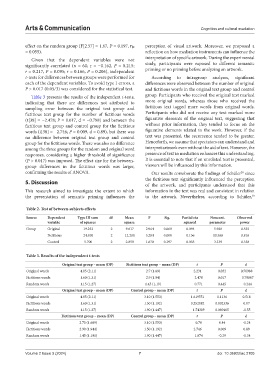
Table 2. Test of between‑subjects effects
Source Dependent Type III sum df Mean F Sig. Partial eta Noncent. Observed
variable of squares square squared parameter power
Group Original 19.233 2 9.617 2.964 0.060 0.094 5.928 0.555
Fictitious 24.400 2 12.200 5.284 0.008 0.156 10.568 0.816
Control 5.700 2 2.850 1.670 0.197 0.055 3.339 0.338
Table 3. Results of the independent t‑tests
Original text group – mean (DP) Fictitious text group – mean (DP) t P d
Original words 4.05 (2.11) 2.7 (1.69) 2.231 0.032 0.70988
Fictitious words 1.60 (1.31) 2.9 (1.94) −2.478 0.017 −0.79807
Random words 1.15 (1.27) 1.45 (1.19) −0.771 0.445 −0.244
Original text group – mean (DP) Control group – mean (DP) t P d
Original words 4.05 (2.11) 3.10 (1.553) 1.619551 0.1136 0.518
Fictitious words 1.60 (1.31) 1.50 (1.192) 0.252082 0.802336 0.07
Random words 1.15 (1.27) 1.90 (1.447) −1.74309 0.089405 -0.55
Fictitious text group – mean (DP) Control group – mean (DP) t P d
Original words 2.70 (1.689) 3.10 (1.553) −0.78 0.44 -0.24
Fictitious words 2.90 (1.944) 1.50 (1.192) 2.746 0.009 0.89
Random words 1.45 (1.191) 1.90 (1.447) −1.074 -0.29 -0.34
Volume 2 Issue 3 (2024) 7 doi: 10.36922/ac.2105