
Page 18 - AC-3-1
P. 18
Arts & Communication Discrimination and dance students’ well-being
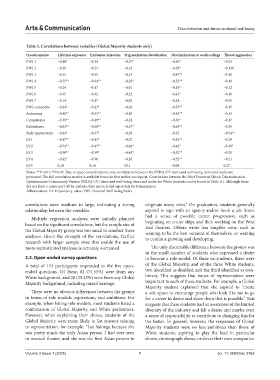
Table 3. Correlations between variables (Global Majority students only)
Questionnaire Lifetime exposure Exclusion/rejection Stigmatization/devaluation Discrimination at work/college Threat/aggression
PWI 1 −0.40* −0.34 −0.37* −0.43* −0.03
PWI 2 −0.29 −0.23 −0.18 −0.38* −0.136
PWI 3 −0.35 −0.35 −0.19 −0.47** −0.10
PWI 4 −0.55** −0.64** −0.36* −0.52** −0.18
PWI 5 −0.24 −0.17 −0.01 −0.39* −0.22
PWI 6 −0.35 −0.32 −0.22 −0.41* −0.10
PWI 7 −0.14 −0.17 −0.02 −0.24 −0.05
PWI composite −0.44* −0.43* −0.26 −0.53** −0.15
Autonomy −0.48** −0.53** −0.30 −0.55** −0.13
Competence −0.39** −0.49** −0.24 −0.36* −0.17
Relatedness −0.63** −0.68** −0.37* −0.63** −0.30
Body Appreciation −0.44* −0.37* −0.28 −0.32 −0.54**
EV1 −0.47** −0.43* −0.27 −0.55** −0.29
EV2 −0.54** −0.47** −0.46* −0.42* −0.38*
EV3 −0.50** −0.39* −0.45* −0.52** −0.20
EV4 −0.42* −0.36 −0.26 −0.52** −0.21
EV5 0.10 0.14 0.01 −0.04 0.27
Notes: **P<0.01; *P<0.05. Due to space considerations, only correlations between the PEDQ-CV items and well-being items and scales are
presented. The full correlation matrix is available from the first author on request. Correlations between the Brief Perceived Ethnic Discrimination
Questionnaire-Community Version (PEDQ-CV) items and well-being items and scales for White students can be found in Table A1. Although these
did not form a major part of the analysis, they are included separately for transparency.
Abbreviations: EV: Expectancy-value; PWI: Personal Well-being Index.
correlations were medium to large, indicating a strong originate many roles.” On graduation, students generally
relationship between the variables. aspired to sign with an agency and/or book a job. Some
had a sense of possible career progression, such as
Multiple regression analyses were initially planned
based on the significant correlations, but the sample size of beginning on cruise ships and then working on the West
the Global Majority group was too small to conduct these End theaters. Others wrote less tangible aims, such as
wanting to be the best versions of themselves, or wanting
analyses. Given the strength of the correlations, further to continue growing and developing.
research with larger sample sizes that enable the use of
more sophisticated analyses is certainly warranted. The only discernible difference between the groups was
in the small number of students who expressed a desire
3.2. Open-ended survey questions to become a role model. Of these six students, three were
A total of 111 participants responded to the five open- of the Global Majority, and of the three White students,
ended questions. Of these, 82 (74.55%) were from any two identified as disabled, and the third identified as non-
White background, and 28 (25.45%) were from any Global binary. This suggests that issues of representation were
Majority background, including mixed heritage. important to each of these students. For example, a Global
Majority student explained that she aspired to “create
There were no obvious differences between the groups a safe space to encourage people who look like me to go
in terms of role models, aspirations, and ambitions. For for a career in dance and show them that is possible.” This
example, when listing role models, most students listed a suggests that these students had an awareness of the limited
combination of Global Majority and White performers. diversity of the industry and felt a desire and maybe even
However, when explaining their choice, students of the a sense of responsibility to contribute to changing this for
Global Majority were more likely to list reasons relating the better. In general, however, the responses of Global
to representation, for example: “Lea Salonga because she Majority students were no less ambitious than those of
was pretty much the only Asian person I had ever seen White students, aspiring to play the lead in particular
in musical theater, and she was the first Asian person to shows, choreograph shows, or direct their own companies.
Volume 3 Issue 1 (2025) 7 doi: 10.36922/ac.3165