
Page 17 - AC-3-1
P. 17
Arts & Communication Discrimination and dance students’ well-being
some multicollinearity, presumably due to the nature of the 3.1.2. Relationships between variables
questions in the PEDQ-CV.
Correlations were conducted to assess relationships
For brevity, only analyses with significant results are between experiences of discrimination and well-being.
reported, but the full set of results is available from the first Given that Global Majority students reported significantly
author on request. Analyses revealed that there were significant more frequent experiences of discrimination, these
differences in PEDQ-CV scores between the Global Majority analyses were performed for Global Majority participants
and White students: F(5, 114) = 6.94, P < 0.001, partial eta- only. There were significant negative correlations between
squared = 0.23. When examining each dependent variable, each subscale of the PEDQ-CV and several of the well-
Global Majority students reported significantly higher scores being variables (Table 3), suggesting that more frequent
for lifetime exposure, F(1, 118) = 27.42, P < 0.001, partial experiences of discrimination were associated with lower
eta-squared = 0.19; exclusion/rejection, F(1, 118) = 25.20, well-being scores. The most influential factors appeared to
P < 0.001, partial eta-squared = 0.18; stigmatization/ be discrimination at work/college (significantly negatively
devaluation, F(1, 118) = 21.65, P < 0.001, partial eta- correlated with 14 well-being variables) and exclusion/
squared = 0.16; and discrimination at work/college, rejection (significantly negatively correlated with nine
F(1, 118) = 13.06, P < 0.001, partial eta-squared = 0.10. well-being variables), although each PEDQ-CV subscale
There were no significant differences between the groups on was significantly negatively correlated with at least two of
any of the well-being measures. the well-being items. Pearson’s r values for the significant
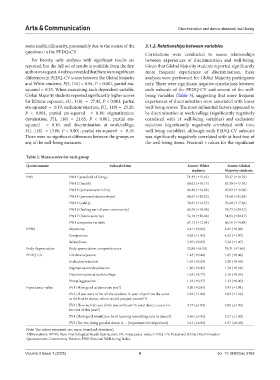
Table 2. Mean scores for each group
Questionnaire Subscale/item Scores: White Scores: Global
students Majority students
PWI PWI 1(standard of living) 71.33 (±15.63) 70.27 (±19.79)
PWI 2 (health) 69.62 (±18.13) 67.30 (±17.10)
PWI 3 (achievement in life) 66.38 (±16.82) 67.03 (±19.98)
PWI 4 (personal relationships) 68.67 (±20.52) 71.08 (±22.58)
PWI 5 (safety) 74.95 (±14.55) 76.49 (±17.36)
PWI 6 (feeling part of your community) 66.76 (±18.48) 59.73 (±20.21)
PWI 7 (future security) 52.10 (±20.46) 54.05 (±20.47)
PWI composite variable 67.12 (±12.34) 66.56 (±14.89)
BPNS Autonomy 4.41 (±0.81) 4.45 (±0.89)
Competence 4.38 (±1.05) 4.32 (±1.07)
Relatedness 5.25 (±0.85) 5.34 (±1.47)
Body Appreciation Body appreciation composite score 32.80 (±8.53) 33.31 (±7.66)
PEDQ-CV Lifetime exposure 1.43 (±0.44) 1.85 (±0.46)
Exclusion/rejection 1.69 (±0.63) 2.28 (±0.69)
Stigmatization/devaluation 1.30 (±0.45) 1.76 (±0.66)
Discrimination at work/college 1.63 (±0.77) 2.10 (±0.65)
Threat/aggression 1.18 (±0.37) 1.32 (±0.43)
Expectancy-value EV1 (How good at dance are you?) 3.20 (±0.81) 3.47 (±1.01)
EV2 (If you were to list all the students in your class from the worst 2.92 (±1.04) 2.93 (±1.26)
to the best in dance, where would you put yourself?)
EV3 (How well do you think you will learn in your dance course for 3.77 (±1.09) 3.80 (±1.03)
the rest of this year?)
EV4 (How good would you be at learning something new in dance?) 3.56 (±0.95) 3.37 (±1.00)
EV5 (For me, being good at dance is… (important/not important) 4.41 (±0.92) 4.57 (±0.68)
Note: The values presented are: mean (standard deviation).
Abbreviations: BPNS: Basic Psychological Needs Satisfaction; EV: Expectancy-value; PEDQ-CV: Perceived Ethnic Discrimination
Questionnaire-Community Version; PWI: Personal Well-being Index.
Volume 3 Issue 1 (2025) 6 doi: 10.36922/ac.3165