
Page 11 - AIH-1-1
P. 11
Artificial Intelligence in Health AI in prostate cancer detection
“cancer”), (“machine” AND (“learn” OR “learning”)) OR The top 20 most cited papers are listed in Table 1,
(“artificial” AND (“intelligence” OR “intelligent”)). The showcasing a diverse range of AI and ML approaches
search results were gathered and filtered to eliminate addressing different aspects of prostate cancer prediction,
duplications, and further refinement included limiting the grading, and image processing using MRI. Table 2
results to publications in the English language. However, summarizes the titles of these highly cited papers. Notably,
there was no strict imposition on the year of publication. 13 out of 20 papers were published from 2017 onwards, yet
To ensure the quality of the selected studies, 293 peer- received a significant number of citations. These citations
reviewed papers were chosen for further analysis. This span diverse areas, encompassing histopathological
curated collection of peer-reviewed articles was exported diagnoses, including grading, and the use of MRI in both
as bibliometric data in commonly used formats, such as diagnosis and the prediction of the diagnosis.
RIS, BIBTEX, and CSV.
Table 2 presents the top 20 most productive and cited
2.2. Research framework authors, the most productive and cited countries, and
the most affiliated institutions in the field. Notably, the
In this work, BA was conducted to perform descriptive
and network analyses using the Bibliometrix R-package . highest number of publications originated from North
[28]
Network analyses were further conducted using the America, followed by Europe. Collectively, the United
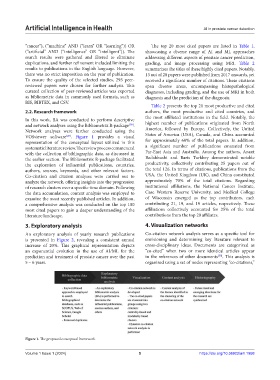
VOSviewer software . Figure 1 provides a visual States of America (USA), Canada, and China accounted
[29]
representation of the conceptual layout utilized in this for approximately 60% of the total papers. In addition,
systematic literature review. The review process commenced a significant number of publications emanated from
with the collection of bibliographic data, as discussed in Far-East Asia and Australia. Among the authors, Anant
the earlier section. The Bibliometrix R-package facilitated Badabhushi and Baris Turkbey demonstrated notable
the exploration of influential publications, countries, productivity, collectively contributing 25 papers out of
authors, sources, keywords, and other relevant factors. the total 126. In terms of citations, publications from the
Co-citation and citation analyses were carried out to USA, the United Kingdom (UK), and China constituted
analyze the network, offering insights into the progression approximately 70% of the total citations. Regarding
of research clusters over a specific time domain. Following institutional affiliations, the National Cancer Institute,
the data accumulation, content analysis was employed to Case Western Reserve University, and Medical College
examine the most recently published articles. In addition, of Wisconsin emerged as the top contributors, each
a comprehensive analysis was conducted on the top 100 contributing 21, 19, and 19 articles, respectively. These
most cited papers to gain a deeper understanding of the affiliations collectively accounted for 25% of the total
literature landscape. contributions from the top 20 affiliates.
3. Exploratory analysis 4. Visualization networks
An exploratory analysis of yearly research publications Co-citation network analysis serves as a specific tool for
is presented in Figure 2, revealing a consistent annual envisioning and determining key literature relevant to
increase of 20%. This graphical representation depicts cross-disciplinary ideas. Documents are categorized as
an exponential evolution in the use of AI/ML for the “co-cited” when two or more identical articles appear
prediction and treatment of prostate cancer over the past in the references of other documents . This analysis is
[50]
5 – 6 years. organized using a set of nodes representing “co-citations,”
Figure 1. The proposed conceptual framework.
Volume 1 Issue 1 (2024) 5 https://doi.org/10.36922/aih.1958