
Page 63 - AIH-1-3
P. 63
Artificial Intelligence in Health ChatGPT in writing scientific articles
A B
C D
E F
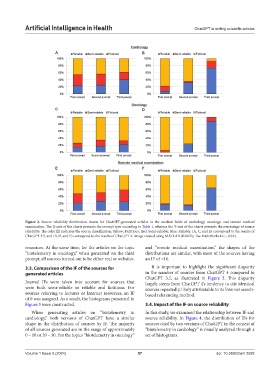
Figure 2. Source reliability distribution charts for ChatGPT-generated articles in the medical fields of cardiology, oncology, and remote medical
examination. The X-axis of the charts presents the prompt type according to Table 1, whereas the Y-axis of the charts presents the percentage of source
reliability. The color fill indicates the source classification: Yellow: Fictitious; Red: Semi-reliable; Blue: Reliable. (A, C, and E) correspond to the results of
ChatGPT 3.5, and (B, D, and F) correspond to the results of ChatGPT 4. Image created using MATLAB (R2021b, The MathWorks Inc., USA).
resources. At the same time, for the articles on the topic and “remote medical examination,” the shapes of the
“biotelemetry in oncology,” when generated on the third distributions are similar, with most of the sources having
prompt, all sources turned out to be either real or websites. an IF of <10.
3.3. Comparison of the IF of the sources for It is important to highlight the significant disparity
generated articles in the number of sources from ChatGPT 4 compared to
ChatGPT 3.5, as illustrated in Figure 3. This disparity
Journal IFs were taken into account for sources that largely stems from ChatGPT 4’s tendency to cite identical
were both semi-reliable or reliable and fictitious. For sources repeatedly, likely attributable to its Internet search-
sources referring to lectures or Internet resources, an IF based referencing method.
of 0 was assigned. As a result, the histograms presented in
Figure 3 were constructed. 3.4. Impact of the IF on source reliability
When generating articles on “biotelemetry in In this study, we examined the relationship between IF and
cardiology,” both versions of ChatGPT have a similar source reliability. In Figure 4, the distribution of IFs for
shape in the distribution of sources by IF. The majority sources cited by two versions of ChatGPT in the context of
of all sources generated are in the range of approximately “biotelemetry in cardiology” is visually analyzed through a
0 – 10 or 20 – 30. For the topics “biotelemetry in oncology” set of histograms.
Volume 1 Issue 3 (2024) 57 doi: 10.36922/aih.2592