
Page 91 - AIH-1-3
P. 91
Artificial Intelligence in Health Dental cavity prediction with computer vision
prediction and post-processing. This step represents the
culmination of our efforts to precisely locate dental cavities
within unknown images, a process that significantly
contributes to the automation of dental health assessment.
The YOLOv5 model, trained on our annotated dataset,
acquired the capability to predict bounding boxes around
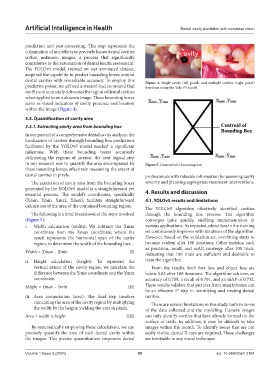
dental cavities with remarkable accuracy. To employ this Figure 4. Single cavity (left panel) and multiple cavities (right panel)
predictive power, we utilized a streamlined command that detection using the Yolo V5 model
swiftly and accurately delineates the region of dental cavities
when applied to an unknown image. These bounding boxes
serve as visual indicators of cavity presence and location
within the image (Figure 4).
3.3. Quantification of cavity area
3.3.1. Extracting cavity area from bounding box
In our pursuit of a comprehensive dental cavity analysis, the
localization of cavities through bounding box predictions
facilitated by the YOLOv5 model marked a significant
milestone. With these bounding boxes accurately
delineating the regions of interest, the next logical step
in our research was to quantify the area encompassed by Figure 5. Centroid of a bounding box
these bounding boxes, effectively measuring the extent of
dental cavities in pixels. professionals with valuable information for assessing cavity
The extraction of cavity area from the bounding boxes severity and planning appropriate treatment interventions.
generated by the YOLOv5 model is a straightforward yet
essential process. The model’s coordinates, specifically 4. Results and discussion
(Xmin, Ymin, Xmax, Ymax), facilitate straightforward 4.1. YOLOv5 results and limitations
calculation of the area of the contained bounding region.
The YOLOv5 algorithm effectively identified cavities
The following is a brief breakdown of the steps involved through the bounding box process. The algorithm
(Figure 5): converges quite quickly, enabling implementation in
i. Width calculation (width): We subtract the Xmin various applications. As expected, object loss in the training
coordinate from the Xmax coordinate, where the set continuously improves with iterations of the algorithm.
result represents the horizontal span of the cavity However, based on the validation set, overfitting starts to
region, to determine the width of the bounding box. become evident after 100 iterations. Other metrics, such
as precision, recall, and mAP, converge after 100 trials,
Width = Xmax – Xmin (I) indicating that 100 trials are sufficient and desirable to
ii. Height calculation (height): To represent the train the algorithm.
vertical extent of the cavity region, we calculate the From the results, both box loss and object loss are
difference between the Ymin coordinate and the Ymax below 0.03 after 100 iterations. The algorithm achieves an
coordinate. accuracy of 0.789, a recall of 0.701, and an mAP of 0.732.
Height = Ymax – Ymin (II) These results validate that pictures from smartphones can
be an effective 1 step in identifying and treating dental
st
iii. Area computation (area): The final step involves cavities.
calculating the area of the cavity region by multiplying There are several limitations in this study, both in terms
the width by the height, yielding the area in pixels. of the data collected and the modeling. Camera images
Area = width × height (III) can only identify cavities that have already formed on the
surface of teeth. In addition, it may be difficult to take
By systematically employing these calculations, we can images within the mouth. To identify issues that are not
precisely quantify the area of each dental cavity within easily visible, dental X-rays are required. These challenges
the images. This precise quantification empowers dental are inevitable in any visual technique.
Volume 1 Issue 3 (2024) 85 doi: 10.36922/aih.3184