
Page 74 - AIH-2-2
P. 74
Artificial Intelligence in Health Improved liver tumor segmentation with dense networks
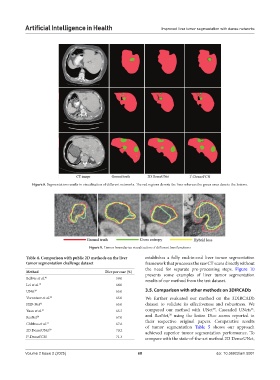
Figure 8. Segmentation results in visualization of different networks. The red regions denote the liver whereas the green ones denote the lesions.
Figure 9. Tumor boundaries visualization of different loss functions
Table 4. Comparison with public 2D methods on the liver establishes a fully end-to-end liver tumor segmentation
tumor segmentation challenge dataset framework that processes the raw CT scans directly without
the need for separate pre-processing steps. Figure 10
Method Dice per case (%)
presents some examples of liver tumor segmentation
Bellver et al. 40 59.0 results of our method from the test dataset.
Lei et al. 19 64.0
UNet 39 65.0 3.5. Comparison with other methods on 3DIRCADb
Vorontsov et al. 22 65.0 We further evaluated our method on the 3DIRCADb
FED-Net 42 65.0 dataset to validate its effectiveness and robustness. We
39
16
Yuan et al. 21 65.7 compared our method with UNet , Cascaded UNets ,
30
ResNet 30 67.0 and ResNet, using the lesion Dice scores reported in
Chlebus et al. 41 67.6 their respective original papers. Comparative results
of tumor segmentation Table 5 shows our approach
2D DenseUNet 29 70.2 achieved superior tumor segmentation performance. To
2
I -DenseFCN 71.3 compare with the state-of-the-art method 2D DenseUNet,
Volume 2 Issue 2 (2025) 68 doi: 10.36922/aih.5001