
Page 31 - AIH-2-4
P. 31
Artificial Intelligence in Health Early Parkinson’s detection through CNNs
Table 1. Details of the subjects in terms of age, gender, and the HY stage
Gender Normal Early PD SWEDD
Count Age (mean) Count Age (mean) HY stage Count Age (mean) HY stage
Female 73 59.32 157 60.91 1.46±0.50 30 58.16 1.4±0.50
Male 136 61.65 286 62.13 1.53±0.50 50 61.80 1.5±0.54
All 209 60.79 443 61.7 1.51±0.50 80 60.43 1.46±0.53
Note: HY stands for Hoehn and Yahr stage.
Abbreviations: PD: Parkinson’s disease; SWEDD: Scans without evidence of dopaminergic deficit.
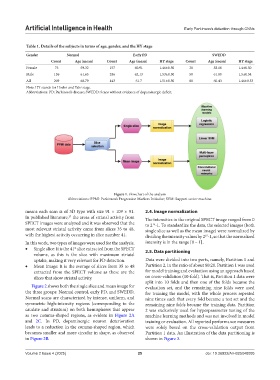
Figure 1. Flowchart of the analysis
Abbreviations: PPMI: Parkinson’s Progression Markers Initiative; SVM: Support vector machine.
means each scan is of 3D type with size 91 × 109 × 91. 2.4. Image normalization
In published literature, the areas of striatal activity from The intensities in the original SPECT image ranged from 0
27
SPECT images were analyzed and it was observed that the to 2 -1. To standardize the data, the selected images (both
15
most relevant striatal activity came from slices 35 to 48, single slice as well as the mean image) were normalized by
with the highest activity occurring in slice number 41. dividing the intensity values by 2 -1, so that the normalized
15
In this work, two types of images were used for the analysis. intensity is in the range [0 – 1].
• Single slice: It is the 41 slice extracted from the SPECT 2.5. Data partitioning
st
volume, as this is the slice with maximum striatal
uptake, making it very relevant for PD detection. Data were divided into two parts, namely, Partition 1 and
• Mean image: It is the average of slices from 35 to 48 Partition 2, in the ratio of about 80:20. Partition 1 was used
extracted from the SPECT volume as these are the for model training and evaluation using an approach based
slices that show striatal activity. on cross-validation (10-fold). That is, Partition 1 data were
split into 10 folds and then one of the folds became the
Figure 2 shows both the single slice and mean image for evaluation set, and the remaining nine folds were used
the three groups: Normal control, early PD, and SWEDD. for training the model, with the whole process repeated
Normal scans are characterized by intense, uniform, and nine times such that every fold became a test set and the
symmetric high-intensity regions (corresponding to the remaining nine folds became the training data. Partition
caudate and striatum) on both hemispheres that appear 2 was exclusively used for hyperparameter tuning of the
as two comma-shaped regions, as evident in Figure 2A machine learning methods and was not involved in model
and 2C. In PD, dopaminergic neuron deterioration training or evaluation. All reported performance measures
leads to a reduction in the comma-shaped region, which were solely based on the cross-validation output from
becomes smaller and more circular in shape, as observed Partition 1 data. An illustration of the data partitioning is
in Figure 2B. shown in Figure 3.
Volume 2 Issue 4 (2025) 25 doi: 10.36922/AIH025040005