
Page 34 - AIH-2-4
P. 34
Artificial Intelligence in Health Early Parkinson’s detection through CNNs
Table 2. The hyperparameters estimated for machine learning models
Method Single slice Mean slice
SVM (linear kernel) C=0.5 C=1
Logistic regression C=3 C=5
MLP Two-layer neural network with the configuration Two-layer neural network with the configuration below:
below: • Hidden layer 1: Dense layer with 128 neurons, activation=ReLU
• Hidden layer 1: Dense layer with 64 neurons, • Output layer: Dense with 2 neurons, activation=Sigmoid
activation=ReLU • Batch size: 8
• Output layer: Dense with 2 neurons, • Number of epochs: 50
activation=Sigmoid • Dropout: 0.2
• Batch size: 8
• Number of epochs: 30
• Dropout: None
CNN • Layer 1: Conv2D with 64 filters, kernel size (3×3), • Layer 1: Conv2D with 32 filters, kernel size (5×5), activation=ReLU
activation=ReLU • Layer 2: MaxPooling2D with pool size (2×2)
• Layer 2: MaxPooling2D with pool size (2×2) • Layer 3: Conv2D with 32 filters, kernel size (5×5), activation=ReLU
• Dropout: 0.1 • Layer 4: MaxPooling2D with pool size (2×2)
• Fully connected layer: Dense with 64 neurons, • Dropout: 0.1
activation=ReLU • Fully connected layer: Dense with 64 neurons, activation=ReLU
• Dropout: 0.3 • Dropout: 0.1
• utput layer: Dense with 2 neurons, • Output layer: Dense with 2 neurons, activation=Sigmoid
activation=Sigmoid
Abbreviations: CNN: Convolutional neural network; MLP: Multilayer perceptron; ReLU: Rectified linear unit; SVM: Support vector machine.
A B
Figure 4. An illustration of misclassifications from the CNN model.
(A) Normal detected as early PD. (B) Early PD detected as normal.
Abbreviations: CNN: Convolutional neural network; PD: Parkinson’s
disease.
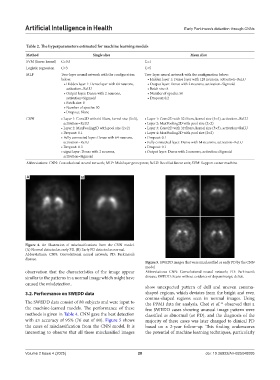
Figure 5. SWEDD images that were misclassified as early PD by the CNN
model
observation that the characteristics of the image appear Abbreviations: CNN: Convolutional neural network; PD: Parkinson’s
similar to the patterns in a normal image which might have disease; SWEDD: Scans without evidence of dopaminergic deficit.
caused the misdetection.
show unexpected pattern of dull and uneven comma-
3.2. Performance on SWEDD data shaped regions, which deviates from the bright and even
comma-shaped regions seen in normal images. Using
The SWEDD data consist of 80 subjects and were input to the PPMI data for analysis, Choi et al. observed that a
11
the machine-learned models. The performance of these few SWEDD cases showing unusual image pattern were
methods is given in Table 4. CNN gave the best detection classified as abnormal (or PD), and the diagnosis of the
with an accuracy of 95% (76 out of 80). Figure 5 shows majority of these cases was later changed to clinical PD
the cases of misclassification from the CNN model. It is based on a 2-year follow-up. This finding underscores
interesting to observe that all these misclassified images the potential of machine learning techniques, particularly
Volume 2 Issue 4 (2025) 28 doi: 10.36922/AIH025040005