
Page 30 - AJWEP-22-4
P. 30
Tekulu and Islam
Table 2. Family size and waste generation rate Table 3. The municipal solid waste disposal
Family No. of Percentage Waste generation rate system’s frequency and cumulative frequency
size families (kg/household/day) Disposal No. of Frequency Cumulative
1 – 2 20 12.1 0.32 system respondents (%) frequency (%)
3 – 4 50 30.3 1.29 Open dump 80 48.5 48.4
5 – 6 80 48.5 1.34 To the waste 30 18.2 18.18
>7 15 6 1.4 collector
Total 165 100 4.35 (average: 1.087) Throwing 55 33.3 33.3
into the
drainage
3.2. The municipal solid waste disposal system Throwing 0 0 3
According to Table 3, 48.5% of respondents disposed beside the
of waste in open areas, 33.3% in drainage channels, pond
and only 18.2% utilized official waste collectors. Field Covered 0 0 6
observations confirmed widespread illegal dumping due dustbin
to a lack of waste bins and irregular collection services, Total 165 10 42.4
a consequence of infrastructure destruction during
the Tigray war. This has led to unsanitary conditions,
unpleasant odors, and the proliferation of disease A B
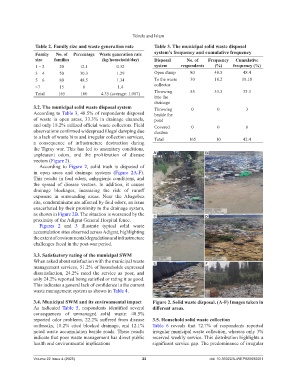
vectors (Figure 2).
According to Figure 2, solid trash is disposed of
in open areas and drainage systems (Figure 2A-F).
This results in foul odors, unhygienic conditions, and
the spread of disease vectors. In addition, it causes
drainage blockages, increasing the risk of runoff
exposure in surrounding areas. Near the Abagobez
site, condominiums are affected by foul odors, an issue
exacerbated by their proximity to the drainage system,
as shown in Figure 2B. The situation is worsened by the C D
proximity of the Adigrat General Hospital fence.
Figures 2 and 3 illustrate typical solid waste
accumulation sites observed across Adigrat, highlighting
the extent of environmental degradation and infrastructure
challenges faced in the post-war period.
3.3. Satisfactory rating of the municipal SWM
When asked about satisfaction with the municipal waste E F
management services, 51.2% of households expressed
dissatisfaction, 24.2% rated the service as poor, and
only 24.2% reported being satisfied or rating it as good.
This indicates a general lack of confidence in the current
waste management system as shown in Table 4.
3.4. Municipal SWM and its environmental impact Figure 2. Solid waste disposal. (A-F) Images taken in
As indicated Table 5, respondents identified several different areas.
consequences of unmanaged solid waste: 48.5%
reported odor problems, 22.2% suffered from disease 3.5. Household solid waste collection
outbreaks, 18.2% cited blocked drainage, and 12.1% Table 6 reveals that 72.7% of respondents reported
noted waste accumulation beside roads. These results irregular municipal waste collection, whereas only 3%
indicate that poor waste management has direct public received weekly service. This distribution highlights a
health and environmental implications significant service gap. The predominance of irregular
Volume 22 Issue 4 (2025) 22 doi: 10.36922/AJWEP025090061