
Page 167 - AJWEP-22-5
P. 167
Emission and carbon policy analysis
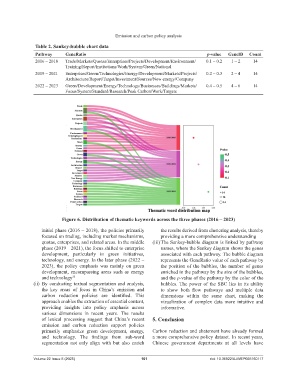
Table 2. Sankey-bubble chart data
Pathway GeneRatio p-value GeneID Count
2016 – 2018 Trade/Markets/Quotas/Enterprises/Projects/Development/Environment/ 0.1 – 0.2 1 – 2 14
Training/Report/Institutions/Work/System/Green/National
2019 – 2021 Enterprises/Green/Technologies/Energy/Development/Markets/Projects/ 0.2 – 0.3 2 – 4 14
Architecture/Report/Target/Investment/Sources/New energy/Company
2022 – 2023 Green/Development/Energy/Technology/Businesses/Buildings/Markets/ 0.4 – 0.5 4 – 6 14
Focus/System/Standard/Research/Peak Carbon/Work/Targets
Figure 6. Distribution of thematic keywords across the three phases (2016 – 2023)
initial phase (2016 – 2018), the policies primarily the results derived from clustering analysis, thereby
focused on trading, including market mechanisms, providing a more comprehensive understanding
quotas, enterprises, and related areas. In the middle (iii) The Sankey-bubble diagram is linked by pathway
phase (2019 – 2021), the focus shifted to enterprise names, where the Sankey diagram shows the genes
development, particularly in green initiatives, associated with each pathway. The bubble diagram
technology, and energy. In the later phase (2022 – represents the GeneRatio value of each pathway by
2023), the policy emphasis was mainly on green the position of the bubbles, the number of genes
development, encompassing areas such as energy enriched in the pathway by the size of the bubbles,
and technology 35 and the p-value of the pathway by the color of the
(ii) By conducting textual segmentation and analysis, bubbles. The power of the SBC lies in its ability
the key areas of focus in China’s emission and to show both flow pathways and multiple data
carbon reduction policies are identified. This dimensions within the same chart, making the
approach enables the extraction of essential content, visualization of complex data more intuitive and
providing insights into policy emphasis across informative.
various dimensions in recent years. The results
of lexical processing suggest that China’s recent 5. Conclusion
emission and carbon reduction support policies
primarily emphasize green development, energy, Carbon reduction and abatement have already formed
and technology. The findings from sub-word a more comprehensive policy dataset. In recent years,
segmentation not only align with but also enrich Chinese government departments at all levels have
Volume 22 Issue 5 (2025) 161 doi: 10.36922/AJWEP025160117