
Page 164 - AJWEP-22-5
P. 164
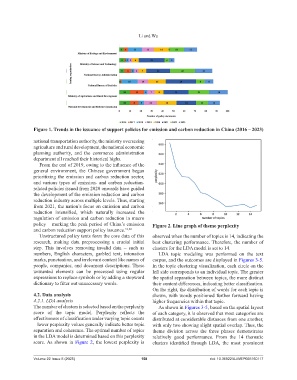
Li and Wu


                Figure 1. Trends in the issuance of support policies for emission and carbon reduction in China (2016 – 2023)


                national transportation authority, the ministry overseeing
                agriculture and rural development, the national economic
                planning authority, and the commerce administration
                department all reached their historical highs.
                  From the end of 2019, owing to the influence of the
                general environment,  the Chinese government began
                prioritizing the emission and carbon reduction sector,
                and various types of emission- and carbon reduction-
                related policies issued from 2020 onwards have guided
                the development of the emission reduction and carbon
                reduction industry across multiple levels. Thus, starting
                from 2021, the nation’s focus on emission and carbon
                reduction  intensified,  which  naturally  increased  the
                regulation of emission and carbon reduction in macro
                policy – marking the peak period of China’s emission   Figure 2. Line graph of theme perplexity
                and carbon reduction support policy issuance. 31,32
                  Unstructured policy texts form the core data of this   observed when the number of topics is 14, indicating the
                research, making  data preprocessing a crucial  initial   best clustering performance. Therefore, the number of
                step.  This involves removing  invalid  data – such as   clusters for the LDA model is set to 14.
                numbers, English characters, garbled text, intonation   LDA topic  modeling  was performed  on the  text
                marks, punctuation, and irrelevant content like names of   corpus, and the outcomes are displayed in Figures 3-5.
                people, companies, and document descriptions. These   In the topic clustering visualization, each circle on the
                unwanted elements  can be processed using regular   left side corresponds to an individual topic. The greater
                expressions to replace symbols or by adding a stopword   the spatial separation between topics, the more distinct
                dictionary to filter out unnecessary words.         their content differences, indicating better classification.
                                                                    On the right, the distribution of words for each topic is
                4.2. Data analysis                                  shown, with words positioned further forward having
                4.2.1. LDA analysis                                 higher frequencies within that topic.
                The number of clusters is selected based on the perplexity   As shown in Figures 3-5, based on the spatial layout
                score  of  the  topic  model.  Perplexity  reflects  the   of each category, it is observed that most categories are
                effectiveness of classification under varying topic counts   distributed at considerable distances from one another,
                – lower perplexity values generally indicate better topic   with only two showing slight spatial overlap. Thus, the
                separation and coherence. The optimal number of topics   theme  division across the  three  phases demonstrates
                in the LDA model is determined based on this perplexity   relatively  good performance.  From the  14  thematic
                score. As shown in  Figure  2, the lowest perplexity is   clusters  identified  through  LDA,  the  most  prominent


                Volume 22 Issue 5 (2025)                       158                           doi: 10.36922/AJWEP025160117