
Page 112 - AJWEP-22-6
P. 112
Takele, et al.
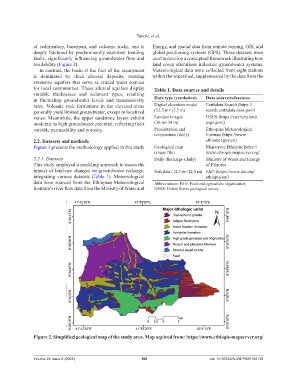
of sedimentary, basement, and volcanic rocks, and is Energy, and spatial data from remote sensing, GIS, and
deeply fractured by predominantly east-west trending global positioning systems (GPS). These datasets were
faults, significantly influencing groundwater flow and used to develop a conceptual framework illustrating how
availability (Figure 2). land cover alterations influence groundwater systems.
In contrast, the basin at the foot of the escarpment Meteorological data were collected from eight stations
is dominated by thick alluvial deposits, forming within the watershed, supplemented by the data from the
extensive aquifers that serve as crucial water sources
for local communities. These alluvial aquifers display Table 1. Data sources and details
variable thicknesses and sediment types, resulting
in fluctuating groundwater levels and transmissivity Data type (resolution) Data source/references
rates. Volcanic rock formations in the elevated areas Digital elevation model Earthdata Search (https://
generally yield limited groundwater, except in localized (12.5 m×12.5 m) search.earthdata.nasa.gov/)
zones. Meanwhile, the upper sandstone layers exhibit Landsat images USGS (https://earthexplorer.
moderate to high groundwater potential, reflecting their (30 m×30 m) usgs.gov/)
variable permeability and porosity. Precipitation and Ethiopian Meteorological
temperature (daily) Institute (https://www.
2.2. Datasets and methods ethiomet.gov.et/)
Figure 3 presents the methodology applied in this study Geological map Mapserver Ethiopia: https://
(shape file) www.ethiogis-mapserver.org/
2.2.1. Datasets Daily discharge (daily) Ministry of Water and Energy
This study employed a modeling approach to assess the of Ethiopia
impact of land-use changes on groundwater recharge, Soil data (12.5 m×12.5 m) FAO (https://www.fao.org/
integrating various datasets (Table 1). Meteorological ethiopia/en/)
data were sourced from the Ethiopian Meteorological Abbreviations: FAO: Food and agriculture organization;
Institute’s river flow data from the Ministry of Water and USGS: United States geological survey.
Figure 2. Simplified geological map of the study area. Map aquired from: https://www.ethiogis-mapserver.org/
Volume 22 Issue 6 (2025) 106 doi: 10.36922/AJWEP025180139