
Page 114 - AJWEP-22-6
P. 114
Takele, et al.
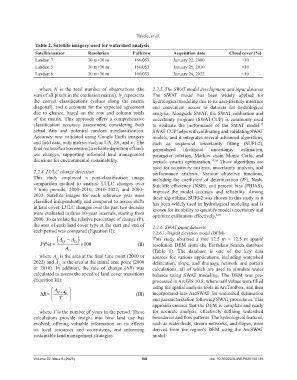
Table 2. Satellite imagery used for watershed analysis
Satellite/sensor Resolution Path/row Acquisition date Cloud cover (%)
Landsat 7 30 m×30 m 166/053 January 22, 2000 <10
Landsat 5 30 m×30 m 166/053 January 25, 2010 <10
Landsat 8 30 m×30 m 166/053 January 26, 2022 <10
where N is the total number of observations (the 2.2.5. The SWAT model development and input datasets
sum of all pixels in the confusion matrix), N represents The SWAT model has been widely applied for
ii
the correct classifications (values along the matrix hydrological modeling due to its user-friendly interface
diagonal), and x accounts for the expected agreement and convenient access to datasets for hydrological
due to chance, based on the row and column totals analysis. Alongside SWAT, the SWAT calibration and
of the matrix. This approach offers a comprehensive uncertainty program (SWAT-CUP) is commonly used
classification accuracy assessment, considering both to evaluate the performance of the SWAT model.
37
actual data and potential random misclassification. SWAT-CUP helps with calibrating and validating SWAT
Accuracy was validated using Google Earth imagery models, and it integrates several advanced algorithms,
and field data, with metrics such as UA, PA, and κ . The such as sequential uncertainty fitting (SUFI-2),
c
final reclassification ensured a reliable depiction of land- generalized likelihood uncertainty estimation,
use changes, supporting informed land management parameter solution, Markov chain Monte Carlo, and
decisions for environmental sustainability. particle swarm optimization. 37,38 These algorithms are
used for sensitivity analysis, uncertainty analysis, and
2.2.4. LULC change detection performance analysis. Various objective functions,
This study employed a post-classification image including the coefficient of determination (R ), Nash-
2
comparison method to analyze LULC changes over Sutcliffe efficiency (NSE), and percent bias (PBIAS),
3 time periods: 2000–2010, 2010–2022, and 2000– improve the model accuracy and reliability. Among
2022. Satellite images for each reference year were these algorithms, SUFI-2 was chosen in this study as it
classified independently and compared to assess shifts has been widely used in hydrological modeling and is
in land cover. LULC changes over the past two decades known for its ability to quantify model uncertainty and
were evaluated in three 10-year intervals, starting from optimize calibration effectively. 8,20
2000. To calculate the relative percentage of change (P),
the area of each land cover type at the start and end of 2.2.6. SWAT input datasets
each period was compared (Equation II): 2.2.6.1. Digital elevation model (DEM)
Lf
A This study obtained a free 12.5 m × 12.5 m spatial
A
P(%) Li 100 (II) resolution DEM from the Earthdata Search database
A Li (Table 1). The database is one of the key data
where A is the area at the final time point (2010 or sources for various applications, including watershed
Lf
2022) and A is the area at the initial time point (2000 delineation, slope, and drainage network and pattern
Li
or 2010). In addition, the rate of change (∆R) was calculations, all of which are used to simulate water
calculated to assess the speed of land cover transitions balance using SWAT modeling. The DEM was pre-
(Equation III): processed in ArcGIS 10.8, where null values were filled
A using the spatial analysis tools in ArcToolbox, and then
R� Lf � A Li (III) incorporated into ArcSWAT for watershed delineation
�
T and parameterization following SWAT procedures. This
approach ensures that the DEM is complete and ready
where T is the number of years in the period. These for accurate analysis, effectively defining watershed
calculations provide insight into how land use has boundaries and flow patterns. The hydrological features,
evolved, offering valuable information on its effects such as watersheds, stream networks, and slopes, were
on local resources and ecosystems, and informing derived from the region’s DEM using the ArcSWAT
sustainable land management strategies. model.
Volume 22 Issue 6 (2025) 108 doi: 10.36922/AJWEP025180139