
Page 116 - AJWEP-22-6
P. 116
Takele, et al.
soil type, slope, and land cover. The HRUs were Focusing on these critical parameters enhanced the
superimposed with soil and land cover data to model model accuracy, ensuring alignment with observed data
elementary hydrological processes such as runoff and and improving its ability to simulate future hydrological
infiltration. Weather data (air temperature and rainfall) responses to changes in land use and climate. Detailed
were employed to tune model performance. Soil data descriptions of the parameters are available in the SWAT
from National Agricultural institute were cross-checked user manual for replication or further refinement. 43,44
with the Food and Agriculture Organization soil map, In this study, both manual and automated techniques
and slope and elevation maps were produced from the were employed using observed river flow data for SWAT
DEM of the region. model calibration. The combination of these approaches
was chosen to ensure greater accuracy and reliability,
2.2.7.1. Watershed delineation and hydrologic response units as manual techniques allow for expert judgment, while
Flow accumulation and direction were developed automated methods enhance efficiency and minimize
using ArcSWAT with the region’s DEM. These steps human error. To allow the model to stabilize, the first
13
are crucial for characterizing the watershed. This 2 years (2000 and 2001) were excluded as a warm-up
study divided the watershed into 30 sub-watersheds, period, following established hydrological modeling
facilitating the detailed visualization of hydrological practices. Calibration was based on 2002–2007 data,
41
units for the simulation of groundwater recharge while validation used 2008–2014 data. For manual
employed in the SWAT model. The land use, soil, calibration, parameters were adjusted through trial
and slope data were combined to define HRUs using and error to enhance the model performance. 38,43 In
thresholds of 20% for land use, 10% for soil, and 20% for addition, the SUFI-2 method was employed to fine-tune
slope-based slope distribution of the region. This unit is parameters within defined ranges, thereby improving
one of the advances made by SWAT in simulating water accuracy through a robust statistical approach. 17,45
balances for watersheds. These HRUs were employed To evaluate the model performance, metrics such as
2
to simulate hydrological processes (e.g., surface runoff R , NSE, and PBIAS were applied. Calibration was
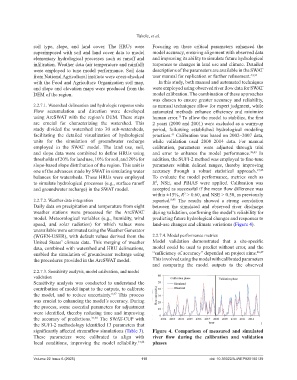
and groundwater recharge) in the SWAT model. accepted as successful if the mean flow difference was
within ±15%, R > 0.60, and NSE > 0.50, as previously
2
2.2.7.2. Weather data integration reported. 8,45 The results showed a strong correlation
Daily data on precipitation and temperature from eight between the simulated and observed river discharge
weather stations were processed for the ArcSWAT during validation, confirming the model’s reliability for
model. Meteorological variables (e.g., humidity, wind predicting future hydrological changes and responses to
speed, and solar radiation) for which values were land-use changes and climate variations (Figure 4).
unavailable were estimated using the Weather Generator
(WGEN-USER), with default values derived from the 2.2.7.4. Model performance metrics
United States’ climate data. This merging of weather Model validation demonstrated that a site-specific
data, combined with watershed and HRU delineations, model could be used to predict without error, and the
enabled the simulation of groundwater recharge using “sufficiency of accuracy” depended on project aims. 46,47
the procedures provided in the ArcSWAT model. This involved using the model with calibrated parameters
and comparing the model outputs to the observed
2.2.7.3. Sensitivity analysis, model calibration, and model
validation
Sensitivity analysis was conducted to understand the
contribution of model input to the outputs, to calibrate
the model, and to reduce uncertainty. 8,37 This process
was crucial to enhancing the model’s accuracy. During
the process, some essential parameters for adjustment
were identified, thereby reducing time and improving
the accuracy of predictions. 37,38 The SWAT-CUP with
the SUFI-2 methodology identified 13 parameters that
significantly affected streamflow simulations (Table 3). Figure 4. Comparison of measured and simulated
These parameters were calibrated to align with river flow during the calibration and validation
local conditions, improving the model reliability. 17,42 phases
Volume 22 Issue 6 (2025) 110 doi: 10.36922/AJWEP025180139