
Page 118 - AJWEP-22-6
P. 118
Takele, et al.
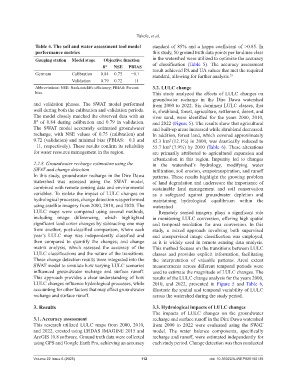
Table 4. The soil and water assessment tool model standard of 85% and a kappa coefficient of >0.85. In
performance metrics this study, 50 ground truth data points per land-use class
Gauging station Model stage Objective function in the watershed were utilized to optimize the accuracy
R 2 NSE PBIAS of classification (Table 5). The accuracy assessment
result achieved PA and UA values that met the required
Germam Calibration 0.84 0.75 −0.1 standard, allowing for further analysis. 35
Validation 0.79 0.72 −11
Abbreviations: NSE: Nash-sutcliffe efficiency; PBIAS: Percent 3.2. LULC change
bias. This study analyzed the effects of LULC changes on
groundwater recharge in the Dire Dawa watershed
and validation phases. The SWAT model performed from 2000 to 2022. Six dominant LULC classes, that
well during both the calibration and validation periods. is, shrubland, forest, agriculture, settlement, desert, and
The model closely matched the observed data with an river sand, were identified for the years 2000, 2010,
R of 0.84 during calibration and 0.79 in validation. and 2022 (Figure 5). The results show that agricultural
2
The SWAT model accurately estimated groundwater and built-up areas increased while shrubland decreased.
recharge, with NSE values of 0.75 (calibration) and In addition, forest land, which covered approximately
0.72 (validation) and minimal bias (PBIAS: −0.1 and 85.3 km (12.1%) in 2000, was drastically reduced to
2
−11, respectively). These results confirm its reliability 55.7 km (7.9%) by 2010 (Table 6). These alterations
2
for water resource management in the region. are primarily attributed to agricultural expansion and
urbanization in this region. Impunity led to changes
2.2.8. Groundwater recharge estimation using the in the watershed’s hydrology, modifying water
SWAT and change detection infiltration, soil erosion, evapotranspiration, and runoff
In this study, groundwater recharge in the Dire Dawa patterns. These results highlight the growing problem
watershed was assessed using the SWAT model, of land degradation and underscore the importance of
combined with remote sensing data and environmental sustainable land management and soil conservation
variables. To isolate the impact of LULC changes on as a safeguard against groundwater depletion and
hydrological processes, change detection was performed maintaining hydrological equilibrium within the
using satellite imagery from 2000, 2010, and 2020. The watershed.
LULC maps were compared using several methods, Remotely sensed imagery plays a significant role
including image differencing, which highlighted in monitoring LULC conversion, offering high spatial
significant land cover changes by subtracting one map and temporal resolution for area conversion. In this
from another; post-classified comparison, where each study, a mixed approach involving both supervised
year’s LULC map was independently classified and and unsupervised image classification was employed,
then compared to quantify the changes; and change as it is widely used in remote sensing data analysis.
matrix analysis, which assessed the accuracy of the This method focuses on the transitions between LULC
LULC classifications and the nature of the transitions. classes and provides explicit information, facilitating
These change detection results were integrated into the the interpretation of valuable patterns. Areal extent
SWAT model to simulate how varying LULC scenarios measurements across different temporal periods were
influenced groundwater recharge and surface runoff. used to estimate the magnitude of LULC changes. The
This approach provides a clear understanding of how results of the LULC change analysis for the years 2000,
LULC changes influence hydrological processes, while 2010, and 2022, presented in Figure 5 and Table 6,
accounting for other factors that may affect groundwater illustrate the spatial and temporal variability of LULC
recharge and surface runoff. across the watershed during the study period.
3. Results 3.3. Hydrological impacts of LULC changes
The impacts of LULC changes on the groundwater
3.1. Accuracy assessment recharge and surface runoff in the Dire Dawa watershed
This research utilized LULC maps from 2000, 2010, from 2000 to 2022 were evaluated using the SWAT
and 2022, created using ERDAS IMAGINE 2015 and model. The water balance components, specifically
ArcGIS 10.8 software. Ground truth data were collected recharge and runoff, were estimated independently for
using GPS and Google Earth Pro, achieving an accuracy each study period. Change detection was then conducted
Volume 22 Issue 6 (2025) 112 doi: 10.36922/AJWEP025180139