
Page 119 - AJWEP-22-6
P. 119
SWAT-based LULC impacts on groundwater recharge
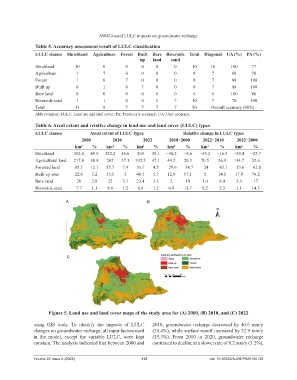
Table 5. Accuracy assessment result of LULC classification
LULC classes Shrubland Agriculture Forest Built Bare Riverside Total Diagonal UA (%) PA (%)
up land sand
Shrubland 10 0 0 0 0 0 10 10 100 77
Agriculture 1 7 0 0 0 0 8 7 88 78
Forest 1 0 7 0 0 0 8 7 88 100
Built up 0 1 0 7 0 0 8 7 88 100
Bare land 0 0 0 0 6 0 6 6 100 86
Riverside sand 1 1 0 0 1 7 10 7 70 100
Total 13 9 7 7 7 7 50 Overall accuracy (88%)
Abbreviations: LULC: Land use and land cover; PA: Producer’s accuracy; UA: User accuracy.
Table 6. Areal extent and relative change in land use and land cover (LULC) types
LULC classes Areal extent of LULC types Relative change in LULC types
2000 2010 2022 2010−2000 2022−2010 2022−2000
km 2 % km 2 % km 2 % km 2 % km 2 % km 2 %
Shrubland 352.4 49.9 322.2 45.6 269 38.1 −30.2 −8.6 −53.2 −16.5 −83.4 −23.7
Agricultural land 217.8 30.9 262 37.1 332.5 47.1 44.2 20.3 70.5 26.9 114.7 52.6
Forested land 85.3 12.1 55.7 7.9 31.7 4.5 −29.6 −34.7 −24 −43.1 −53.6 −62.8
Built-up area 22.6 3.2 35.5 5 40.5 5.7 12.9 57.1 5 14.1 17.9 79.2
Bare land 20 2.8 22 3.1 23.4 3.3 2 10 1.4 6.4 3.4 17
Riverside sand 7.7 1.1 8.6 1.2 8.8 1.2 0.9 11.7 0.2 2.3 1.1 14.3
A B
C
Figure 5. Land use and land cover maps of the study area for (A) 2000, (B) 2010, and (C) 2022
using GIS tools. To identify the impacts of LULC 2010, groundwater recharge decreased by 40.6 mm/y
changes on groundwater recharge, all input factors used (20.4%), while surface runoff increased by 32.9 mm/y
in the model, except the variable LULC, were kept (15.3%). From 2010 to 2020, groundwater recharge
constant. The analysis indicated that between 2000 and continued to decline at a slower rate of 8.2 mm/y (5.2%),
Volume 22 Issue 6 (2025) 113 doi: 10.36922/AJWEP025180139