
Page 108 - {PDF Title}
P. 108
Diriba and Fitamo
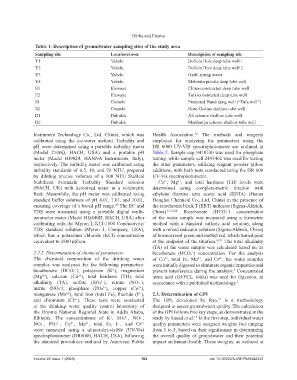
Table 1. Description of groundwater sampling sites of the study area
Sampling site Location/town Description of sampling site
Y1 Yabelo Dollolo Hola deep tube well 1
Y2 Yabelo Dollolo Hola deep tube well 2
Y3 Yabelo Garbi spring water
Y4 Yabelo Mebiratu private deep tube well
E1 Elewaye China-constructed deep tube well
E2 Elewaye Turk-constructed deep tube well
S1 Gomole Protected Hund dung well (“Tula well”)
S2 Gomole Goro Gudina shallow tube well
D1 Dubuluk Ali scheme shallow tube well
D2 Dubuluk Manhariya scheme shallow tube well
Instrument Technology Co., Ltd. China), which was Health Association. The methods and reagents
30
calibrated using the ice-water method. Turbidity and employed for analyzing the parameters using the
pH were determined using a portable turbidity meter DR 6000 UV-VIS spectrophotometer are outlined in
(Model 2100Q, HACH, USA) and a portable pH Table 2. Sample cup 9418100 was used for phosphate
meter (Model HI9024, HANNA Instruments, Italy), testing, while sample cell 2495402 was used for testing
respectively. The turbidity meter was calibrated using the other parameters, utilizing reagent powder pillow
turbidity standards of 0.5, 10, and 20 NTU, prepared additions, with both tests conducted using the DR 600
by diluting precise volumes of a 100 NTU Stablcal UV-Vis spectrophotometer.
Stabilized Formazin Turbidity Standard solution Ca²⁺, Mg²⁺, and total hardness (TH) levels were
(HACH, UK) with deionized water in a volumetric determined using complexometric titration with
flask. Meanwhile, the pH meter was calibrated using ethylene diamine tetra acetic acid (EDTA) (Henan
standard buffer solutions of pH 4.01, 7.01, and 10.01, Honghai Chemical Co., Ltd, China) in the presence of
ensuring coverage of a broad pH range. The EC and the eriochrome black T (EBT) indicator (Sigma-Aldrich,
29
TDS were measured using a portable digital multi- China). 13,19,24 Bicarbonate (HCO₃⁻) concentration
parameter meter (Model HQ440D, HACH, USA) after of the water sample was measured using a titrimetric
calibrating with the Myron L KCl-1800 Conductivity/ method with a standard sulfuric acid solution, along
TDS standard solution (Myron L Company, USA), with a mixed indicator solution (Sigma-Aldrich, China)
which has a potassium chloride (KCl) concentration of bromocresol green and methyl red, which turned pink
equivalent to 1800 µS/cm. at the endpoint of the titration. 16,31 The total alkalinity
(TA) of the water sample was calculated based on its
2.2.2. Determination of chemical parameters bicarbonate (HCO₃⁻) concentration. For the analysis
The chemical composition of the drinking water of Cu²⁺, total Fe, Mn²⁺, and Cr⁶⁺, the water samples
samples was analyzed for the following parameters: were initially digested to eliminate organic impurities and
bicarbonate (HCO₃⁻), potassium (K⁺), magnesium prevent interference during the analysis. Concentrated
7
(Mg²⁺), calcium (Ca²⁺), total hardness (TH), total nitric acid (DFPCL, India) was used for digestion, in
alkalinity (TA), sulfate (SO₄²⁻), nitrate (NO₃⁻), accordance with a published methodology. 5
nitrite (NO₂⁻), phosphate (PO₄³⁻), copper (Cu²⁺),
manganese (Mn²⁺), total iron (total Fe), fluoride (F⁻), 2.3. Determination of GPI
and chromium (Cr⁶⁺). These tests were conducted The GPI, developed by Rao, is a methodology
17
at the drinking water quality control laboratory of designed to assess groundwater quality. The calculation
the Oromia National Regional State in Addis Ababa, of the GPI follows five key steps, as demonstrated in the
Ethiopia. The concentrations of K⁺, SO₄²⁻, NO₃⁻, study by Sanad et al. In the first step, individual water
13
NO₂⁻, PO₄³⁻, Cu²⁺, Mn²⁺, total Fe, F⁻, and Cr⁶⁺ quality parameters were assigned weights (wᵢ) ranging
were measured using a ultraviolet-visible (UV-Vis) from 1 to 5, based on their significance in determining
spectrophotometer (DR6000, HACH, USA), following the overall quality of groundwater and their potential
the standard procedures outlined by American Public impact on human health. These weights, as outlined in
Volume 22 Issue 1 (2025) 102 doi: 10.36922/AJWEP025040023