
Page 112 - {PDF Title}
P. 112
Diriba and Fitamo
parameters—pH, TDS, HCO₃⁻, Ca²⁺, Mg²⁺, K⁺, SO₄²⁻, SI W q (VIII)
NO₃⁻, PO₄³⁻, TH, Cu²⁺, Fe, and F⁻—along with their i i i
corresponding WHO standard values (Table 4). 33,34 These where the SI is the sub-index value of i parameter, q
th
i
i
parameters were selected based on recommendations is the rating based on the concentration of i parameter
th
from previous studies. 12,16,32,35 and n is the number of parameters.
The calculation of the WQI involves four steps, as
described by Berhe, Ha et al., and Sanad et al. . n n
13
32
12
i
In the first step, the physicochemical parameters WQI i 1 SI in Wiqi (VIII)
were assigned weights (wi) on a scale of 1 – 5, as
presented in Table 4. These weights were determined where the SI is the sub-index value of i parameter,
th
i
based on similar studies conducted by Berhe, Sanad Wi is the relative weight, q is the rating based on the
12
i
et al., Al-Aizari et al., Panneerselvam et al., and concentration of i parameter and n is the number of
19
13
18
th
Ha et al. 32 parameters.
In the second step, the relative weight (Wᵢ) for
each parameter was calculated using Equation I, as 2.6. Data analysis
shown in Table 4. The third step involved assigning Descriptive statistics, including percentages, means, and
a quality rating scale (qᵢ) to each parameter using ranges, were computed for the physicochemical data of
Equation VI. drinking water samples. A Pearson correlation matrix
(r) analysis was performed to quantify the relationships
C among the physicochemical parameters and between
q i 100 (VI) the physicochemical parameters and the WQI. All data
i
S i
analyses were conducted using Microsoft Excel 2016.
where Ci represents the experimental concentration 3. Results and discussion
of each parameter in each water sample, measured in
mg/L, and Si refers to the standard concentration for 3.1. Physicochemical analysis
each water quality parameter in drinking water, as The average values of the physicochemical parameters
recommended by the WHO, 33,34 also in mg/L. used to assess the quality of groundwater in the study
Finally, the sub-index (SIᵢ) value for each water area are presented in Table 5, alongside comparisons
quality parameter was calculated using Equation VII, with the drinking water quality standards established
and the WQI for each groundwater source was by the Ethiopian Standards Agency (ESA) and the
36
calculated using Equation VIII. The resulting scores WHO. 34
were classified into five water quality categories, as
shown in Table 6. 3.1.1. pH
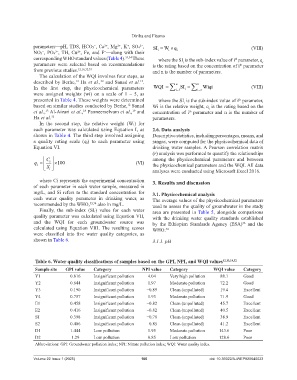
Table 6. Water quality classifications of samples based on the GPI, NPI, and WQI values 12,13,18,32
Sample site GPI value Category NPI value Category WQI value Category
Y1 0.816 Insignificant pollution 4.04 Very high pollution 88.1 Good
Y2 0.644 Insignificant pollution 1.97 Moderate pollution 72.2 Good
Y3 0.190 Insignificant pollution −0.89 Clean (unpolluted) 19.4 Excellent
Y4 0.757 Insignificant pollution 1.93 Moderate pollution 71.9 Good
E1 0.458 Insignificant pollution −0.82 Clean (unpolluted) 45.7 Excellent
E2 0.416 Insignificant pollution −0.82 Clean (unpolluted) 40.5 Excellent
S1 0.398 Insignificant pollution −0.78 Clean (unpolluted) 38.9 Excellent
S2 0.406 Insignificant pollution −0.85 Clean (unpolluted) 41.2 Excellent
D1 1.444 Low pollution 1.95 Moderate pollution 143.6 Poor
D2 1.29 Low pollution 0.85 Low pollution 128.6 Poor
Abbreviations: GPI: Groundwater pollution index; NPI: Nitrate pollution index; WQI: Water quality index.
Volume 22 Issue 1 (2025) 106 doi: 10.36922/AJWEP025040023