
Page 111 - {PDF Title}
P. 111
Groundwater quality assessment in Borana
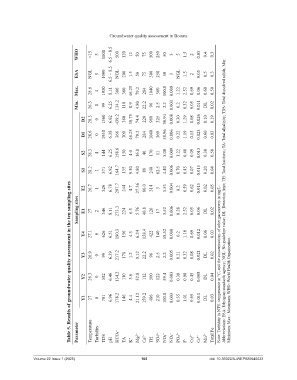
WHO ˂15 5 1000 6.5 – 8.5 500 120 12 50 75 500 250 50 3 5 1.5 2 0.05 0.4 0.3
ESA NGL 5 1000 6.5 – 8.5 NGL 200 1.5 50 75 300 250 50 3 NGL 1.5 2 0.05 0.5 0.3
Max. 28.6 4 1930 8.11 366 360 46.25 79.2 284 1040 360 100.8 0.009 1.22 2.52 0.69 0.06 0.60 0.50
Min. 26.3 0 99 6.25 134.2 110 0.9 4.80 22.2 96 2.5 2.2 0.003 0.2 0.32 0.05 0.011 DL 0.02
D2 28.3 0 1560 6.62 439.2 360 38.75 74.4 220 960 325 36.94 0.008 0.30 1.29 0.08 0.026 0.10 0.19
D1 28.6 0 1930 6.38 366 300 46.25 79.2 284 1040 360 58.96 0.006 0.22 1.19 0.15 0.023 0.60 0.03
S2 28.3 4 144 6.25 158.6 130 4.0 16.8 40 170 11 3.08 0.009 1.22 0.40 0.09 0.013 0.30 0.50
S1 28.2 1 371 6.92 164.7 135 9.50 4.80 88 240 62.5 4.40 0.006 0.70 0.43 0.07 0.015 0.20 0.04
Table 5. Results of groundwater quality assessment in the ten sampling sites
E2 26.7 1 326 6.78 297.7 244 4.7 27.36 80.0 314 3 3.53 0.004 0.2 0.59 0.62 0.015 0.02 0.05
Sampling sites E1 27 2 346 8.11 273.3 224 6.5 5.76 40.8 126 17 3.52 0.006 0.28 2.52 0.05 0.06 DL 0.02 Abbreviations: ESA: Ethiopian standards agency; NGL: No guideline value; DL: Detection limit; TH: Total hardness; TA: Total alkalinity; TDS: Total dissolved solids; Min:
Y4 27.1 0 626 6.51 190.3 156 4.3 6.24 158.4 422 140 58.52 0.008 0.2 1.18 0.69 0.012 0.06 0.03
Y3 26.9 0 99 6.39 217.2 178 1.2 9.12 22.2 96 2.5 2.2 0.005 0.21 0.32 0.08 0.021 DL 0.02 Note: Turbidity in NTU, temperature in °C, and the concentrations of other parameters in mg/L.
Y2 26.3 0 582 6.46 134.2 110 3.6 52.8 112 500 122 59.4 0.003 0.38 0.98 0.45 0.008 DL 0.04
Y1 27 0 701 6.96 178.2 146 4.4 21.12 159.2 486 210 100.8 0.003 0.35 1.01 0.65 0.011 DL 0.03 Minimum; Max.: Maximum; WHO: World Health Organization.
Parameter Temperature Turbidity TDS pH HCO₃⁻ TA K + Mg 2+ Ca 2+ TH SO₄²⁻ NO₃⁻ NO₂⁻ PO₄ 3 ⁻ F - Cu 2+ Cr 6+ Mn 2+ Total Fe
Volume 22 Issue 1 (2025) 105 doi: 10.36922/AJWEP025040023