
Page 72 - AJWEP-v22i2
P. 72
Ghosh and Prakasam
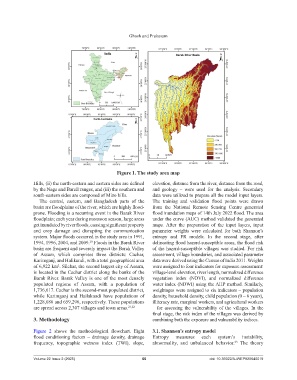
Figure 1. The study area map
Hills, (ii) the north-eastern and eastern sides are defined elevation, distance from the river, distance from the road,
by the Naga and Barail ranges, and (iii) the southern and and geology – were used for the analysis. Secondary
south-eastern sides are composed of Mizo hills. data were utilized to prepare all the model input layers.
The central, eastern, and Bangladesh parts of the The training and validation flood points were drawn
basin are floodplains of the river, which are highly flood- from the National Remote Sensing Centre generated
prone. Flooding is a recurring event in the Barak River flood inundation maps of 14th July 2022 flood. The area
floodplain; each year during monsoon season, large areas under the curve (AUC) method validated the generated
get inundated by river floods, causing significant property maps. After the preparation of the input layers, input
and crop damage and disrupting the communication parameter weights were calculated for both Shannon’s
system. Major floods occurred in the study area in 1991, entropy and FR models. In the second stage, after
1994, 1996, 2004, and 2009. Floods in the Barak River delineating flood hazard-susceptible areas, the flood risk
20
basin are frequent and severely impact the Barak Valley of the hazard-susceptible villages was studied. For risk
of Assam, which comprises three districts: Cachar, assessment, village boundaries, and associated parameter
Karimganj, and Halikandi, with a total geographical area data were derived using the Census of India 2011. Weights
of 6,922 km . Silchar, the second largest city of Assam, were assigned to four indicators for exposure assessment:
2
is located in the Cachar district along the banks of the village-level elevation, river length, normalized difference
Barak River. Barak Valley is one of the most densely vegetation index (NDVI), and normalized difference
populated regions of Assam, with a population of water index (NDWI) using the AHP method. Similarly,
1,736,617. Cachar is the second-most populated district, weightages were assigned to six indicators – population
while Karimganj and Hailakandi have populations of density, household density, child population (0 – 6 years),
1,228,686 and 659,296, respectively. These populations illiteracy rate, marginal workers, and agricultural workers
are spread across 2,307 villages and town areas. 21,22 – for assessing the vulnerability of the villages. In the
final stage, the risk index of the villages was derived by
3. Methodology combining both the exposure and vulnerability indices.
Figure 2 shows the methodological flowchart. Eight 3.1. Shannon’s entropy model
flood conditioning factors – drainage density, drainage Entropy measures each system’s instability,
frequency, topographic wetness index (TWI), slope, abnormality, and unbalanced behavior. The theory
23
Volume 22 Issue 2 (2025) 66 doi: 10.36922/AJWEP025040019