
Page 77 - AJWEP-v22i2
P. 77
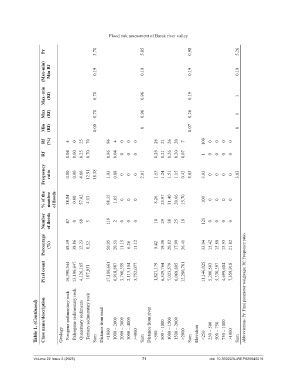
Flood risk assessment of Barak river valley


                     Pr                    3.70                 5.05                 0.98                 5.26

                     (Max‑min)  Min Rf     0.19                 0.19                 0.19                 0.19


                     Max–min   (Rf)        0.70                 0.96                 0.19                 1


                     Max   (Rf)            0.70                 0.96                 0.26                 1


                     Min   (Rf)            0.00                 0                    0.07                 0


                     Rf   (%)  4  0  25  70      96  4  0  0  0       26  21  26  20  7    100  0  0  0  0


                     Rf        0.04  0.00  0.25  0.70  0.96  0.04  0  0  0  0.26  0.21  0.26  0.20  0.07  1  0  0  0  0

                     Frequency   ratio  0.80  0.00  4.66  12.91  18.38  1.93  0.08  0  0  0  2.01  1.53  1.24  1.51  1.15  0.43  5.85  3.03  0  0  0  0  3.03


                     % of the   number   of floods  38.84  0.00  57.02  4.13  98.35  1.65  0  0  0  8.26  23.97  31.40  20.66  15.70  100  0  0  0  0


                     Number   of floods  47  0  69  5  119  2  0  0  0  10  29  38  25  19  121  0  0  0  0


                     Percentage   (%)  48.59  38.86  12.23  0.32  50.95  20.51  11.15  6.26  11.12  5.42  19.36  20.82  17.99  36.41  33.04  15.42  15.80  13.93  21.82


                     Pixel count  16,390,344  13,106,647  4,126,165  107,931  17,186,661  6,918,887  3,760,359  2,113,104  3,752,077  1,827,179  6,529,764  7,023,579  6,069,805  12,280,761  11,146,025  5,200,503  5,330,397  4,699,604  7,359,918 Abbreviations: Pr: Final parameter weightage; Rf: Frequency ratio.


                 Table 1. (Continued)  Class name/description  Geology  Neogene sedimentary rock  Paleogene sedimentary rock  Quaternary sediments   Tertiary sedimentary rock   Sum  Distance from road  <1000  1000 – 2000  2000 – 3000  3000 – 4000  >4000  Sum  Distance from river   <500  500 – 1000  1000 – 1500  1500 – 2000  >2000  Sum  Elevation   <250   250 – 500  500 – 750  750 – 1000  >1000  Sum


                Volume 22 Issue 2 (2025)                        71                           doi: 10.36922/AJWEP025040019