
Page 81 - AJWEP-v22i2
P. 81
Flood risk assessment of Barak river valley
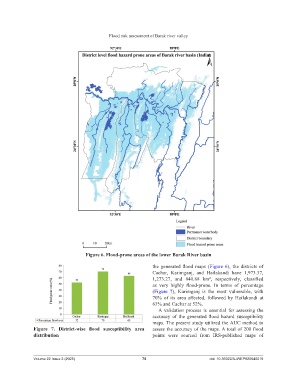
Figure 6. Flood‑prone areas of the lower Barak River basin
the generated flood maps (Figure 6), the districts of
Cachar, Karimganj, and Hailakandi have 1,973.37,
1,273.27, and 840.88 km , respectively, classified
2
as very highly flood-prone. In terms of percentage
(Figure 7), Karimganj is the most vulnerable, with
70% of its area affected, followed by Hailakandi at
63% and Cachar at 52%.
A validation process is essential for assessing the
accuracy of the generated flood hazard susceptibility
maps. The present study utilized the AUC method to
Figure 7. District‑wise flood susceptibility area assess the accuracy of the maps. A total of 200 flood
distribution points were sourced from IRS-published maps of
Volume 22 Issue 2 (2025) 75 doi: 10.36922/AJWEP025040019