
Page 79 - AJWEP-v22i2
P. 79
Flood risk assessment of Barak river valley
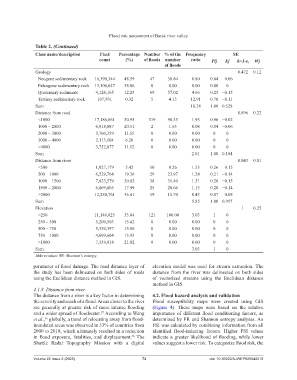
Table 2. (Continued)
Class name/description Pixel Percentage Number % of the Frequency SE
count (%) of floods number ratio Pij Ej h=1‑e j Wj
of floods
Geology 0.472 0.12
Neogene sedimentary rock 16,390,344 48.59 47 38.84 0.80 0.04 −0.06
Paleogene sedimentary rock 13,106,647 38.86 0 0.00 0.00 0.00 0
Quaternary sediments 4,126,165 12.23 69 57.02 4.66 0.25 −0.15
Tertiary sedimentary rock 107,931 0.32 5 4.13 12.91 0.70 −0.11
Sum 18.38 1.00 0.528
Distance from road 0.896 0.22
<1000 17,186,661 50.95 119 98.35 1.93 0.96 −0.02
1000 – 2000 6,918,887 20.51 2 1.65 0.08 0.04 −0.06
2000 – 3000 3,760,359 11.15 0 0.00 0.00 0 0
3000 – 4000 2,113,104 6.26 0 0.00 0.00 0 0
>4000 3,752,077 11.12 0 0.00 0.00 0 0
Sum 2.01 1.00 0.104
Distance from river 0.043 0.01
<500 1,827,179 5.42 10 8.26 1.53 0.26 −0.15
500 – 1000 6,529,764 19.36 29 23.97 1.24 0.21 −0.14
1000 – 1500 7,023,579 20.82 38 31.40 1.51 0.26 −0.15
1500 – 2000 6,069,805 17.99 25 20.66 1.15 0.20 −0.14
>2000 12,280,761 36.41 19 15.70 0.43 0.07 −0.08
Sum 5.85 1.00 0.957
Elevation 1 0.25
<250 11,146,025 33.04 121 100.00 3.03 1 0
250 – 500 5,200,503 15.42 0 0.00 0.00 0 0
500 – 750 5,330,397 15.80 0 0.00 0.00 0 0
750 – 1000 4,699,604 13.93 0 0.00 0.00 0 0
>1000 7,359,918 21.82 0 0.00 0.00 0 0
Sum 3.03 1 0
Abbreviation: SE: Shannon’s entropy.
parameter of flood damage. The road distance layer of elevation model was used for stream extraction. The
the study has been delineated on both sides of roads distance from the river was delineated on both sides
using the Euclidean distance method in GIS. of vectorized streams using the Euclidean distance
method in GIS.
4.1.8. Distance from river
The distance from a river is a key factor in determining 4.2. Flood hazard analysis and validation
the severity and reach of a flood. Areas closer to the river Flood susceptibility maps were created using GIS
are generally at greater risk of more intense flooding (Figure 4). These maps were based on the relative
and a wider spread of floodwater. According to Wang importance of different flood conditioning factors, as
27
et al., globally, a trend of relocating away from flood- determined by FR and Shannon entropy analyses. An
36
inundated areas was observed in 53% of countries from FSI was calculated by combining information from all
2000 to 2018, which ultimately resulted in a reduction identified flood-inducing factors. Higher FSI values
in flood exposure, fatalities, and displacement. The indicate a greater likelihood of flooding, while lower
36
Shuttle Radar Topography Mission with a digital values suggest a lower risk. To categorize flood risk, the
Volume 22 Issue 2 (2025) 73 doi: 10.36922/AJWEP025040019