
Page 80 - AJWEP-v22i2
P. 80
Ghosh and Prakasam
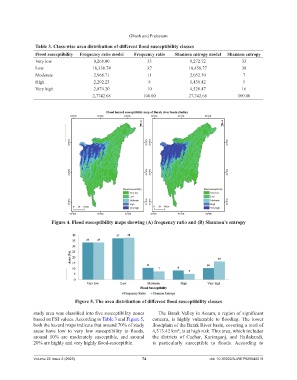
Table 3. Class‑wise area distribution of different flood susceptibility classes
Flood susceptibility Frequency ratio model Frequency ratio Shannon entropy model Shannon entropy
Very low 9,268.80 33 9,272.72 33
Low 10,338.74 37 10,458.77 38
Moderate 2,968.71 11 2,052.30 7
High 2,292.23 8 1,438.42 5
Very high 2,874.20 10 4,520.47 16
2,7742.68 100.00 27,742.68 100.00
Figure 4. Flood susceptibility maps showing (A) frequency ratio and (B) Shannon’s entropy
Figure 5. The area distribution of different flood susceptibility classes
study area was classified into five susceptibility zones The Barak Valley in Assam, a region of significant
based on FSI values. According to Table 3 and Figure 5, concern, is highly vulnerable to flooding. The lower
both the hazard maps indicate that around 70% of study floodplain of the Barak River basin, covering a total of
areas have low to very low susceptibility to floods, 4,513.42 km , is at high risk. This area, which includes
2
around 10% are moderately susceptible, and around the districts of Cachar, Karimganj, and Hailakandi,
20% are highly and very highly flood-susceptible. is particularly susceptible to floods. According to
Volume 22 Issue 2 (2025) 74 doi: 10.36922/AJWEP025040019