
Page 78 - AJWEP-v22i2
P. 78
Ghosh and Prakasam
major geological formations: (i) Neogene sedimentary 4.1.7. Distance from road
rock, (ii) Paleogene sedimentary rock, (iii) quaternary The distance from a road is a significant parameter in
sediments, and (iv) tertiary sedimentary rock. Notably, assessing flood risk. Due to their impervious nature,
48.59% and 38.86% of the Barak River basin have roads reduce the absorption of rainwater into the ground,
Neogene and Paleogene sedimentary rock formations, contributing to increased runoff and potential flooding.
27
respectively. Neogene sedimentary rock is found along
the middle, eastern, and southern parts, and the quaternary In addition, they may act like artificial barriers in surface
sediments are found throughout the floodplains of the runoff flow. Road network defines the connectivity and
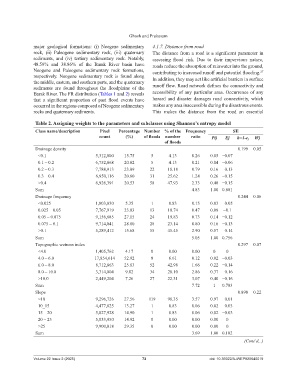
Barak River. The FR distribution (Tables 1 and 2) reveals accessibility of any particular area. Occurrence of any
that a significant proportion of past flood events have hazard and disaster damages road connectivity, which
occurred in the regions composed of Neogene sedimentary makes any area inaccessible during the disastrous events.
rocks and quaternary sediments. This makes the distance from the road an essential
Table 2. Assigning weights to the parameters and subclasses using Shannon’s entropy model
Class name/description Pixel Percentage Number % of the Frequency SE
count (%) of floods number ratio Pij Ej h=1‑e j Wj
of floods
Drainage density 0.199 0.05
<0.1 5,312,800 15.75 5 4.13 0.26 0.05 −0.07
0.1 – 0.2 6,752,868 20.02 5 4.13 0.21 0.04 −0.06
0.2 – 0.3 7,788,913 23.09 22 18.18 0.79 0.16 −0.13
0.3 – 0.4 6,950,116 20.60 31 25.62 1.24 0.26 −0.15
>0.4 6,926,391 20.53 58 47.93 2.33 0.48 −0.15
Sum 4.83 1.00 0.801
Drainage frequency 0.244 0.06
<0.025 1,803,030 5.35 1 0.83 0.15 0.03 −0.05
0.025 – 0.05 7,767,919 23.03 13 10.74 0.47 0.09 −0.1
0.05 – 0.075 9,156,685 27.15 24 19.83 0.73 0.14 −0.12
0.075 – 0.1 9,714,041 28.80 28 23.14 0.80 0.16 −0.13
>0.1 5,289,412 15.68 55 45.45 2.90 0.57 −0.14
Sum 5.05 1.00 0.756
Topographic wetness index 0.297 0.07
<4.0 1,405,762 4.17 0 0.00 0.00 0 0
4.0 – 6.0 17,854,614 52.92 8 6.61 0.12 0.02 −0.03
6.0 – 8.0 8,712,863 25.83 52 42.98 1.66 0.22 −0.14
8.0 – 10.0 3,314,004 9.82 34 28.10 2.86 0.37 −0.16
>10.0 2,449,204 7.26 27 22.31 3.07 0.40 −0.16
Sum 7.72 1 0.703
Slope 0.898 0.22
<10 9,296,726 27.56 119 98.35 3.57 0.97 −0.01
10_15 4,477,825 13.27 1 0.83 0.06 0.02 −0.03
15 – 20 5,027,928 14.90 1 0.83 0.06 0.02 −0.03
20 – 25 5,033,950 14.92 0 0.00 0.00 0.00 0
>25 9,900,018 29.35 0 0.00 0.00 0.00 0
Sum 3.69 1.00 0.102
(Cont’d...)
Volume 22 Issue 2 (2025) 72 doi: 10.36922/AJWEP025040019