
Page 76 - AJWEP-v22i2
P. 76
Ghosh and Prakasam
Pr 2.35 2.86 2.09 5.10 (Cont’d...)
(Max‑min) Min Rf 0.19 0.19 0.19 0.19
Max–min (Rf) 0.44 0.54 0.40 0.97
Max (Rf) 0.48 0.57 0.40 0.97
Min (Rf) 0.04 0.03 0 0.00
Rf (%) 5 4 16 26 48 3 9 14 16 57 0 2 22 37 40 97 2 2 0 0
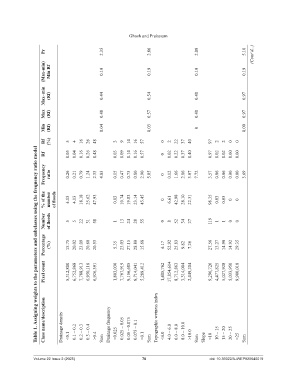
Table 1. Assigning weights to the parameters and subclasses using the frequency ratio model
Rf 0.05 0.04 0.16 0.26 0.48 0.03 0.09 0.14 0.16 0.57 0 0.02 0.22 0.37 0.40 0.97 0.02 0.02 0.00 0.00
Frequency ratio 0.26 0.21 0.79 1.24 2.33 4.83 0.15 0.47 0.73 0.80 2.90 5.05 0 0.12 1.66 2.86 3.07 7.72 3.57 0.06 0.06 0.00 0.00 3.69
% of the number of floods 4.13 4.13 18.18 25.62 47.93 0.83 10.74 19.83 23.14 45.45 0 6.61 42.98 28.10 22.31 98.35 0.83 0.83 0 0
Number of floods 5 5 22 31 58 1 13 24 28 55 0 8 52 34 27 119 1 1 0 0
Percentage (%) 15.75 20.02 23.09 20.60 20.53 5.35 23.03 27.15 28.80 15.68 4.17 52.92 25.83 9.82 7.26 27.56 13.27 14.90 14.92 29.35
Pixel count 5,312,800 6,752,868 7,788,913 6,950,116 6,926,391 1,803,030 7,767,919 9,156,685 9,714,041 5,289,412 1,405,762 17,854,614 8,712,863 3,314,004 2,449,204 9,296,726 4,477,825 5,027,928 5,033,950 9,900,018
Class name/description Drainage density <0.1 0.1 – 0.2 0.2 – 0.3 0.3 – 0.4 >0.4 Sum Drainage frequency <0.025 0.025 – 0.05 0.05 – 0.075 0.075 – 0.1 >0.1 Sum Topographic wetness index <4.0 4.0 – 6.0 6.0 – 8.0 8.0 – 10.0 >10.0 Sum Slope <10 10 – 15 15 – 20 20 – 25 >25 Sum
Volume 22 Issue 2 (2025) 70 doi: 10.36922/AJWEP025040019