
Page 84 - AJWEP-v22i2
P. 84
Ghosh and Prakasam
A B
C D
E F
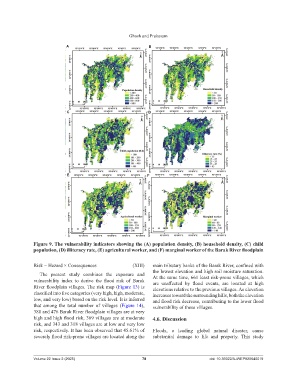
Figure 9. The vulnerability indicators showing the (A) population density, (B) household density, (C) child
population, (D) illiteracy rate, (E) agricultural worker, and (F) marginal worker of the Barak River floodplain
Risk = Hazard × Consequences (XIII) main tributary banks of the Barak River, confined with
the lowest elevation and high soil moisture saturation.
The present study combines the exposure and
vulnerability index to derive the flood risk of Barak At the same time, 661 least risk-prone villages, which
are unaffected by flood events, are located at high
River floodplain villages. The risk map (Figure 13) is elevations relative to the previous villages. As elevation
classified into five categories (very high, high, moderate, increases toward the surrounding hills, both the elevation
low, and very low) based on the risk level. It is inferred and flood risk decrease, contributing to the lower flood
that among the total number of villages (Figure 14), vulnerability of these villages.
388 and 476 Barak River floodplain villages are at very
high and high flood risk, 369 villages are at moderate 4.6. Discussion
risk, and 343 and 318 villages are at low and very low
risk, respectively. It has been observed that 45.61% of Floods, a leading global natural disaster, cause
severely flood risk-prone villages are located along the substantial damage to life and property. This study
Volume 22 Issue 2 (2025) 78 doi: 10.36922/AJWEP025040019