
Page 197 - AJWEP-v22i3
P. 197
The portable hydroponic system
parameters and operating modes of the improved
(xiv) b − Y 0 is the deviation from the predicted value, portable hydroponic NFT unit to ensure maximum
0
(xv) S is the reproducibility dispersion. efficiency in plant growth and development. The results
2
y
The calculated value t was then compared to the obtained from the implementation of the experimental
d
critical value from the statistical tables, selected matrix are presented in Table 3.
24
based on the significance level of α = 0.05 and degrees The experimental data were processed using the
24
of freedom f = N. If the inequality, |b | < |Δb | was STATISTICA 12 software package (StatSoft, USA),
i
i
t
satisfied, the corresponding factor was considered for which was used to construct statistical mathematical
reassessment, particularly regarding the possibility models for the following response variables: Y (plant
1
of adjusting its variation interval. In such a case, height), Y (time to reach the baby leaf stage), Y (fresh
3
2
all relevant experiments were repeated. If, after weight), and Y (number of leaves).
4
reassessment, the coefficient continued to meet the The resulting regression equations are as follows:
same condition, it was concluded that the influence Y 3.46+0.16x + 0.26x + 0.66x + 0.01x x + 0.01x x
1 3
1 2
3
2
=
1
of the factor x on the optimization parameter was + 0.01x x + 0.01x x (XI)
1 2X3
2 3
i
statistically insignificant Y. Y = 14.5 – 0.5x – 1.0x – 2.0x (XII)
i
The purpose of interpreting the resulting statistical 2 1 2 3
model is to analyze the influence of factors on the Y = 0.95 + 0.05x + 0.1x + 0.2x 3 (XIII)
3
1
2
optimization criterion. The degree of influence of each Y = 5.625 + 0.375x + 0.875x + 1.875x + 0.125x x +
4
2
1
1 2
factor was assessed based on the value and sign of the 0.125x x + 0.125x x + 0.125x x x 3 (XIV)
corresponding regression coefficient b . A positive sign 1 3 2 3 1 2 3
i
(+) indicates that an increase in the factor x leads to The significance of the obtained regression
i
an increase in the optimization parameter Y, while a coefficients was evaluated using Student’s t-test. For
i
negative sign (−) indicates that an increase in x results a reliability level (P ) of 0.95 and degrees of freedom
H
i
in a decrease in Y. f = 7, the tabulated t-value is t = 2.365. 23
i
After verification, simplified regression equations
3. Results and discussion for Y , Y , Y , and Y were obtained:
1
2
3
4
Y (plant height): Y = 3.46 + 0.16x + 0.26x + 0.66x 3
1
1
1
2
A central compositional matrix plan 2 was established (XV)
3
to evaluate the effects of several factors, including the Y (time to reach baby leaf stage: Y = 14.5 − 0.5x –
1
EM-5 concentrate, air and nutrient solution temperature, 1.0x – 2.0x 2 (XVI)
2
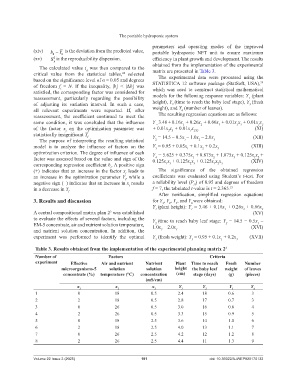
and nutrient solution concentration. In addition, the 2 3
experiment was performed to identify the optimal Y (fresh weight): Y = 0.95 + 0.1x + 0.2x (XVII)
3 3 1 3
Table 3. Results obtained from the implementation of the experimental planning matrix 2 3
Number of Factors Criteria
experiment Effective Air and nutrient Nutrient Plant Time to reach Fresh Number
microorganisms‑5 solution solution height the baby leaf weight of leaves
concentrate (%) temperature (°C) concentration (cm) stage (days) (g) (pieces)
(mS/cm)
x 1 x 2 x 3 Y 1 Y 2 Y 3 Y 4
1 0 18 0.5 2.4 18 0.6 3
2 2 18 0.5 2.8 17 0.7 3
3 0 26 0.5 3.0 16 0.8 4
4 2 26 0.5 3.3 15 0.9 5
5 0 18 2.5 3.6 14 1.0 6
6 2 18 2.5 4.0 13 1.1 7
7 0 26 2.5 4.2 12 1.2 8
8 2 26 2.5 4.4 11 1.3 9
Volume 22 Issue 3 (2025) 191 doi: 10.36922/AJWEP025170132