Page 199 - AJWEP-v22i3
P. 199

The portable hydroponic system

                              A                                    B


                                                 C


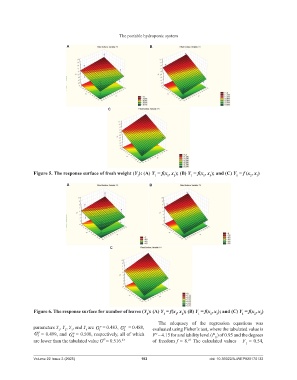
                Figure 5. The response surface of fresh weight (Y ): (A) Y  = f(x , x ); (B) Y  = f(x , x ); and (C) Y  = f (x , x )
                                                                              2
                                                                           1
                                                                     1
                                                                                                         1
                                                                                                               2
                                                                                                                  3
                                                                                           1
                                                                                     1
                                                                                             3
                                                              3
                              A                                    B


                                                 C


                Figure 6. The response surface for number of leaves (Y ): (A) Y  = f(x , x ); (B) Y  = f(x , x ); and (C) Y  = f(x , x )
                                                                                              1
                                                                                 2
                                                                                        1
                                                                         1
                                                                  4
                                                                                                                 2
                                                                              1
                                                                                                                    3
                                                                                                3
                                                                                                            1
                                                                       The  adequacy  of  the  regression  equations  was
                parameters Y , Y , Y , and Y are G = 0.483, G  = 0.488,   evaluated using Fisher’s test, where the tabulated value is
                                             p
                                                        p
                                                        2
                                3
                                             1
                           1
                              2
                                       4
                  p
                G 3 = 0.499, and  G = 0.500, respectively, all of which   F  = 4.15 for a reliability level (P ) of 0.95 and the degrees
                                 p
                                                                     T
                                 4
                                                                                                H
                are lower than the tabulated value G  = 0.516. 23   of freedom f = 8.  The calculated values – F  = 0.54,
                                                                                    23
                                              T
                                                                                                             1
                Volume 22 Issue 3 (2025)                       193                           doi: 10.36922/AJWEP025170132
   194   195   196   197   198   199   200   201   202   203   204