
Page 198 - AJWEP-v22i3
P. 198
Vasylkovska, et al.
A B
C
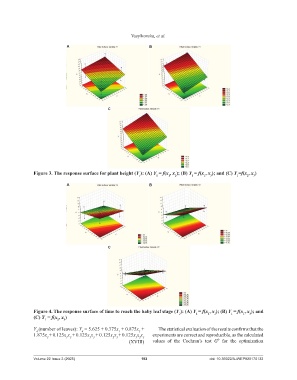
Figure 3. The response surface for plant height (Y ): (A) Y = f(x , x ); (B) Y = f(x , x ); and (C) Y =f(x , x )
1 1 1 2 1 1 3 1 2 3
A B
C
Figure 4. The response surface of time to reach the baby leaf stage (Y ): (A) Y = f(x , x ); (B) Y = f(x , x ); and
2
1
1
3
1
1
2
(C) Y = f(x , x )
1
2
3
Y (number of leaves): Y = 5.625 + 0.375x + 0.875x + The statistical evaluation of the results confirms that the
2
4
4
1
1.875x + 0.125x x + 0.125x x + 0.125x x + 0.125x x x experiments are correct and reproducible, as the calculated
3 1 2 1 3 2 3 1 2 3
P
(XVIII) values of the Cochran’s test G for the optimization
Volume 22 Issue 3 (2025) 192 doi: 10.36922/AJWEP025170132