
Page 84 - AJWEP-v22i3
P. 84
Hossain and Rahman
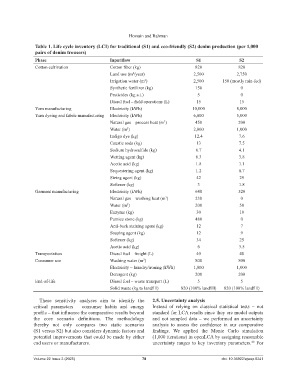
Table 1. Life cycle inventory (LCI) for traditional (S1) and eco-friendly (S2) denim production (per 1,000
pairs of denim trousers)
Phase Input/flow S1 S2
Cotton cultivation Cotton fiber (kg) 820 820
Land use (m /year) 2,500 2,750
2
Irrigation water (m ) 2,500 150 (mostly rain-fed)
3
Synthetic fertilizer (kg) 150 0
Pesticides (kg a.i.) 5 0
Diesel fuel – field operations (L) 15 15
Yarn manufacturing Electricity (kWh) 10,000 8,000
Yarn dyeing and fabric manufacturing Electricity (kWh) 6,000 5,000
Natural gas – process heat (m ) 450 200
3
Water (m ) 2,000 1,000
3
Indigo dye (kg) 12.4 7.6
Caustic soda (kg) 13 7.5
Sodium hydrosulfide (kg) 6.7 4.1
Wetting agent (kg) 6.3 3.8
Acetic acid (kg) 1.8 1.1
Sequestering agent (kg) 1.2 0.7
Sizing agent (kg) 42 29
Softener (kg) 3 1.8
Garment manufacturing Electricity (kWh) 640 520
Natural gas – washing heat (m ) 230 0
3
Water (m ) 200 50
3
Enzyme (kg) 30 10
Pumice stone (kg) 480 0
Anti-back staining agent (kg) 12 7
Soaping agent (kg) 12 9
Softener (kg) 34 25
Acetic acid (kg) 6 3.5
Transportation Diesel fuel – freight (L) 40 40
Consumer use Washing water (m ) 800 800
3
Electricity – laundry/ironing (kWh) 1,000 1,000
Detergent (kg) 200 200
End-of-life Diesel fuel – waste transport (L) 5 5
Solid waste (kg to landfill) 820 (100% landfill) 820 (100% landfill)
These sensitivity analyses aim to identify the 2.5. Uncertainty analysis
critical parameters – consumer habits and energy Instead of relying on classical statistical tests – not
profile – that influence the comparative results beyond standard for LCA results since they are model outputs
the core scenario definitions. The methodology and not sampled data – we performed an uncertainty
thereby not only compares two static scenarios analysis to assess the confidence in our comparative
(S1 versus S2) but also considers dynamic factors and findings. We applied the Monte Carlo simulation
potential improvements that could be made by either (1,000 iterations) in openLCA by assigning reasonable
end users or manufacturers. uncertainty ranges to key inventory parameters. For
40
Volume 22 Issue 3 (2025) 78 doi: 10.36922/ajwep.6241