
Page 88 - AJWEP-v22i3
P. 88
Hossain and Rahman
denim manufacturing does not simply shift environmental total life-cycle energy and water consumption increased
burdens from one category to another but genuinely for both S1 and S2. In this extreme case, the use
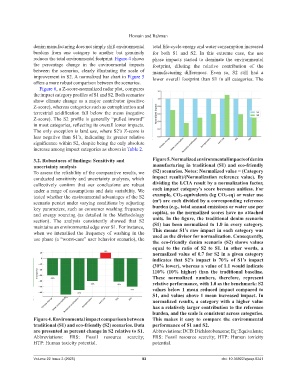
reduces the total environmental footprint. Figure 4 shows phase impacts started to dominate the environmental
the percentage change in the environmental impacts footprint, diluting the relative contribution of the
between the scenarios, clearly illustrating the scale of manufacturing differences. Even so, S2 still had a
improvement in S2. A normalized bar chart in Figure 5 lower overall footprint than S1 in all categories. The
offers a more robust comparison between the scenarios.
Figure 6, a Z-score-normalized radar plot, compares
the impact category profiles of S1 and S2. Both scenarios
show climate change as a major contributor (positive
Z-score), whereas categories such as eutrophication and
terrestrial acidification fall below the mean (negative
Z-score). The S2 profile is generally “pulled inward”
in most categories, reflecting its overall lower impacts.
The only exception is land use, where S2’s Z-score is
less negative than S1’s, indicating its greater relative
significance within S2, despite being the only absolute
increase among impact categories as shown in Table 2.
3.2. Robustness of findings: Sensitivity and Figure 5. Normalized environmental impacts of denim
uncertainty analysis manufacturing in traditional (S1) and eco-friendly
To assess the reliability of the comparative results, we (S2) scenarios. Notes: Normalized value = (Category
conducted sensitivity and uncertainty analyses, which impact result)/(Normalization reference value). By
collectively confirm that our conclusions are robust dividing the LCIA result by a normalization factor,
under a range of assumptions and data variability. We each impact category’s score becomes unitless. For
tested whether the environmental advantages of the S2 example, CO₂-equivalents (kg CO₂-eq) or water use
scenario persist under varying conditions by adjusting (m³) are each divided by a corresponding reference
key parameters, such as consumer washing frequency burden (e.g., total annual emissions or water use per
and energy sourcing (as detailed in the Methodology capita), so the normalized scores have no attached
section). The analysis consistently showed that S2 units. In the figure, the traditional denim scenario
maintains an environmental edge over S1. For instance, (S1) has been normalized to 1.0 in every category.
when we intensified the frequency of washing in the This means S1’s raw impact in each category was
used as the divisor for normalization. Consequently,
use phase (a “worst-case” user behavior scenario), the
the eco-friendly denim scenario (S2) shows values
equal to the ratio of S2 to S1. In other words, a
normalized value of 0.7 for S2 in a given category
indicates that S2’s impact is 70% of S1’s impact
(30% lower), whereas a value of 1.1 would indicate
110% (10% higher) than the traditional baseline.
These normalized numbers, therefore, represent
relative performance, with 1.0 as the benchmark: S2
values below 1 mean reduced impact compared to
S1, and values above 1 mean increased impact. In
normalized results, a category with a higher value
has a relatively larger contribution to the reference
burden, and the scale is consistent across categories.
Figure 4. Environmental impact comparison between This makes it easy to compare the environmental
traditional (S1) and eco-friendly (S2) scenarios. Data performance of S1 and S2.
are presented as percent change in S2 relative to S1. Abbreviations: DCB: Dichlorobenzene; Eq: Equivalents;
Abbreviations: FRS: Fossil resource scarcity; FRS: Fossil resource scarcity; HTP: Human toxicity
HTP: Human toxicity potential. potential.
Volume 22 Issue 3 (2025) 82 doi: 10.36922/ajwep.6241