
Page 14 - AN-1-1
P. 14
Advanced Neurology AIS in patients with COVID-19
Male, n (%) - - 110 (55.3) - -
COVID-19 negative Age, mean [SD] or median [IQR] (years) - - 71.0 (14.9) - -
Sample Size - - 199 - -
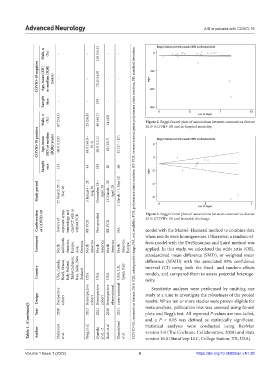
Male, n (%) 67 (54.5) 25 (56.8) 46 (44.7) 14 (63) Figure 2. Begg’s funnel plots of associations between coronavirus disease
2019 (COVID-19) and in-hospital mortality.
COVID-19 positive Age, mean [SD] or median [IQR] (years) 68.6 (13.9) 64.0 (59.0 – 81.5) 68.8 (15.1) 63 (10.7) 51 (27 – 87)
Sample size 123 44 103 20 66
Study period 27 March 20 – 1 May 20 3 January – 28 Aug 20 December 19 – April 20 15 March – 30 April 20 1 March – 1 May 20 COVID-19, coronavirus disease 2019; IQR, interquartile range; NA, not available; PCR, polymerase chain reaction; RT-PCR, reverse-transcriptase polymerase chain reaction; SD, standard deviation.
Confirmation of COVID-19 history of exposure, symp- tomatology, and chest CT with or without PCR RT-PCR Not specified RT-PCR Figure 3. Begg’s funnel plots of associations between coronavirus disease
2019 (COVID-19) and favorable discharge.
NA
model with the Mantel–Haenszel method to combine data
when results were homogeneous. Otherwise, a random-ef-
Continent North and South America, Europe, Asia, Oceania North America North America North America North America, Europe fects model with the DerSimonian and Laird method was
applied. In this study, we calculated the odds ratio (OR),
standardized mean difference (SMD), or weighted mean
interval (CI) using both the fixed- and random-effects
Country USA, Canada, Brazil, Greece, Italy, Finland, Turkey,Lebanon, Iran, India,, New Zealand USA USA USA USA, UK, Spain, Italy difference (WMD) with the associated 95% confidence
models, and compared them to assess potential heteroge-
neity.
Sensitivity analyses were performed by omitting one
Design Prospective cohort Retrospective cohort Retrospective cohort Retrospective observational cross-sectional study at a time to investigate the robustness of the pooled
results. When ten or more studies were proven eligible for
Table 1. (Continued). Year Author 2020 Shahjouei et al. 2021 Peng et al. 2021 Qureshi et al. -2 2020 Bach et al. 2021 Khandelwal et al. plots and Begg’s test. All reported P-values are two-tailed,
meta-analysis, publication bias was assessed using funnel
and a P < 0.05 was defined as statistically significant.
Statistical analyses were conducted using RevMan
version 5.0 (The Cochrane Collaboration, 2020) and Stata
https://doi.org/10.36922/an.v1i1.28
Volume 1 Issue 1 (2022) 6 version 16.0 (StataCorp LLC, College Station, TX, USA).