
Page 10 - AN-1-2
P. 10
Advanced Neurology Pantothenic acid in kainic acid-induced epilepsy
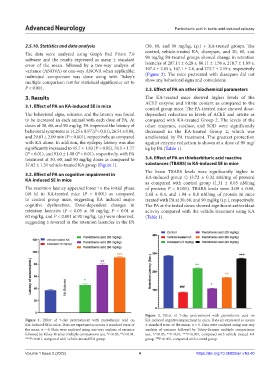
2.5.10. Statistics and data analysis (30, 60, and 90 mg/kg, i.p.) + KA-treated groups. The
The data were analyzed using Graph Pad Prism 7.0 control, vehicle-treated KA, diazepam, and 30, 60, and
software and the results expressed as mean ± standard 90 mg/kg PA-treated groups showed change in retention
error of the mean. followed by a two-way analysis of latencies of 287.14 ± 6.28 s, 86.11 ± 1.56 s, 218.7 ± 1.89 s,
variance (ANOVA) or one-way ANOVA when applicable; 107.4 ± 2.65 s, 167.1 ± 2.6, and 272.7 ± 2.19 s, respectively
individual comparison was done using with Tukey’s (Figure 2). The mice pretreated with diazepam did not
multiple comparison test for statistical significance set to show any behavioral signs and convulsions.
P < 0.001. 3.3. Effect of PA on other biochemical parameters
3. Results The KA-treated mice showed higher levels of the
AChE enzyme and nitrite content as compared to the
3.1. Effect of PA on KA-induced SE in mice control group mice. The PA-treated mice showed dose-
The behavioral signs, seizures, and the latency was found dependent reduction in levels of AChE and nitrite as
to be increased in each animal with each dose of PA. At compared with KA-treated Group 2. The levels of the
doses of 30, 60, and 90 mg/kg, PA improved the latency of other enzymes, catalase, and SOD were significantly
behavioral symptoms to 14.25 ± 0.97 (P < 0.01), 26.54 ± 0.88, decreased in the KA-treated Group 2, which was
and 29.81 ± 2.09 min (P < 0.001), respectively, as compared ameliorated by PA treatment. The greatest protection
with KA alone. In addition, the epilepsy latency was also against enzyme reduction is shown at a dose of 90 mg/
significantly increased to 45.7 ± 1.83 (P < 0.05), 78.5 ± 1.77 kg by PA (Table 1).
(P < 0.01), and 91.0 ± 1.08 (P < 0.01), respectively, with PA
treatment at 30, 60, and 90 mg/kg doses as compared to 3.4. Effect of PA on thiobarbituric acid reactive
37.02 ± 1.31 vehicle-treated KA group (Figure 1). substances (TBARS) in KA-induced SE in mice
The brain TBARS levels were significantly higher in
3.2. Effect of PA on cognitive impairment in KA-induced group () (3.72 ± 0.32 nM/mg of protein)
KA-induced SE in mice
as compared with control group (1.31 ± 0.05 nM/mg
The retention latency appeared lower in the initial phase of protein; P < 0.001). TBARS levels were 3.09 ± 0.98,
(48 h) in KA-treated mice (P < 0.001) as compared 2.68 ± 0.4, and 1.94 ± 0.8 nM/mg of protein in mice
to control group mice, suggesting KA induced major treated with PA at 30, 60, and 90 mg/kg (i.p.), respectively.
cognitive dysfunction. Dose-dependent changes in The PA at the tested doses showed significant antioxidant
retention latencies (P < 0.05 at 30 mg/kg, P < 0.01 at activity compared with the vehicle treatment using KA
60 mg/kg, and P < 0.001 at 90 mg/kg, i.p.) were observed, (Table 1).
suggesting a reversal in the retention latencies in the PA
Figure 2. Effect of 7-day pretreatment with pantothenic acid on
Figure 1. Effect of 7-day pretreatment with pantothenic acid on KA-induced cognitive impairment in mice. Data are expressed as means
KA-induced SE in mice. Data are expressed as means ± standard error of ± standard error of the mean, n = 6. Data were analyzed using one-way
the mean, n = 6. Data were analyzed using one-way analysis of variance analysis of variance followed by Tukey-Kramer multiple comparisons
followed by Tukey-Kramer multiple comparisons test. *P<0.05, **P<0.01, test. *P<0.05, **P<0.01, ***P<0.001, compared with vehicle-treated KA
***P<0.001, compared with vehicle-treated KA group. group. P<0.001, compared with control group.
###
Volume 1 Issue 2 (2022) 4 https://doi.org/10.36922/an.v1i2.40