
Page 12 - AN-1-2
P. 12
Advanced Neurology Pantothenic acid in kainic acid-induced epilepsy
Table 2. Effect of pantothenic acid on kainic acid‑induced changes in body and brain weight of mice with epilepsy
Group Change in body weight (BW, g) a Brain weight (g) Brain/BW ratio/100 g of mice weight
Male Female Male Female Male Female
1 0.44±0.11 −0.41±0.24 1.06±0.32 1.02±0.16 1.02 1.01
2 1.07±0.19 0.19±0.08 0.73±0.19 0.68±0.13 0.67 0.43
3 −2.53±0.89* −2.92±0.82* 0.86±0.22* 0.98±0.03** 0.83 0.85
4 −1.76±0.76 −3.95±0.65 0.96±0.43* 0.87±0.88* 0.77 0.65
5 −2.32±0.43* −3.69±0.76 1.08±0.13** 1.29±0.76** 0.83 0.79
6 −4.51±1.07** −3.06±0.74* 1.12±0.22*** 1.31±0.54*** 0.71 1.08
Data are expressed as means±standard error of the mean, n = 6. Data were analyzed using one-way analysis of variance followed by Tukey-Kramer
multiple comparisons test. *P < 0.05, **P < 0.01, and ***P < 0.001 compared with vehicle-treated KA group (i.e., Group 2). Group 1: Control group,
Group 2: Vehicle-treated KA group consisting of untreated KA-induced mice, Group 3: Group of diazepam-treated KA-induced mice, Group 4: Group
of pantothenic acid (30 mg/kg, p.o.)-treated KA-induced mice, Group 5: Group of pantothenic acid (60 mg/kg, p.o.)-treated KA-induced mice, and
a
Group 6: Group of pantothenic acid (90 mg/kg, p.o.)-treated KA-induced mice. Initial day BW - final day BW
Table 3. Effect of pantothenic acid on monoamine oxidase A B
level in brain tissues
Group MAO‑A MAO‑B
Level (nM/mg Inhibition Level (nM/ Inhibition
protein·h) (%) mg protein·h) (%)
1 22.1±0.32 23.2±0.24 C D
2 27.4.1±0.82 00 32.1±0.76 00
3 27.1±0.43* 3.89 23.1±0.19* 00
4 25.76±0.36 10 28.76±1.02 17
5 22.8±0.54* 21 18.2±0.54 35
6 21.3±0.33** 35 12.4±1.03* 65
E F
Data are expressed as means±standard error of the mean, n = 6.
Data were analyzed using one-way analysis of variance followed
by Tukey-Kramer multiple comparisons test. *P < 0.05, **P < 0.01,
***P < 0.001 compared with vehicle-treated KA group (i.e., Group 2).
Group 1: Control group, Group 2: Vehicle-treated KA group consisting
of untreated KA-induced mice, Group 3: Group of diazepam-treated
KA-induced mice, Group 4: Group of pantothenic acid (30 mg/
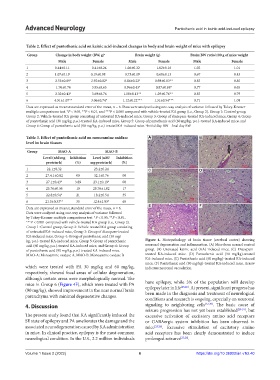
kg, p.o.)-treated KA-induced mice, Group 5: Group of pantothenic Figure 4. Histopathology of brain tissue (cerebral cortex) showing
acid (60 mg/kg, p.o.)-treated KA-induced mice, and Group 6: Group neuronal degeneration and inflammation. (A) Mice from normal control
of pantothenic acid (90 mg/kg, p.o.)-treated KA-induced mice. group. (B) Untreated kainic acid (KA)-induced mice. (C) Diazepam-
MAO-A: Monoamine oxidase A, MAO-B: Monoamine oxidase B treated KA-induced mice. (D) Pantothenic acid (30 mg/kg)-treated
KA-induced mice. (E) Pantothenic acid (60 mg/kg)-treated KA-induced
mice. (F) Pantothenic acid (90 mg/kg)-treated KA-induced mice. Arrow
which were treated with PA 30 mg/kg and 60 mg/kg, indicates neuronal vacuolation.
respectively, showed focal areas of cellular degeneration,
although certain areas were morphologically normal. The
mice in Group 6 (Figure 4F), which were treated with PA have epilepsy, while 3% of the population will develop
[25,26]
(90 mg/kg), showed improvement in the near normal brain epilepsy later in life . At present, significant progress has
parenchyma with minimal degenerative changes. been made in the diagnosis and treatment of neurological
conditions and research is ongoing, especially on neuronal
4. Discussion signaling to neighboring cells [27,28] . The basic cause of
seizure progression has not yet been established [29-31] , but
The present study found that KA significantly induced the excessive activation of excitatory amino acid receptors
SE state of epilepsy and PA ameliorates the damage and the or GABAergic system inhibition has been observed in
associated neurodegeneration caused by KA administration mice [25,26] . Excessive stimulation of excitatory amino
in mice. In clinical practice, epilepsy is the most common acid receptors has been clearly demonstrated to induce
neurological condition. In the U.S., 2.2 million individuals prolonged seizures [25,26] .
Volume 1 Issue 2 (2022) 6 https://doi.org/10.36922/an.v1i2.40