
Page 61 - AN-2-3
P. 61
Advanced Neurology Voluntary running effects in PTEN knockout mouse
A A
B
B
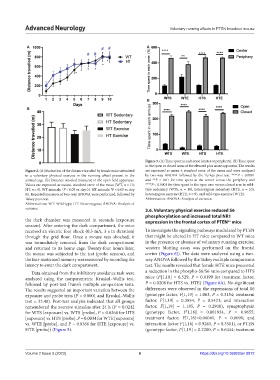
Figure 3. (A) Time spent in each zone (center or periphery). (B) Time spent
in the open or closed arms of the elevated plus maze apparatus. The results
Figure 2. (A) Evaluation of the distance traveled by female mice submitted are expressed as mean ± standard error of the mean and were analyzed
to a voluntary physical exercise in the running wheel present in the by two-way ANOVA followed by the Turkey post-test. ****P < 0.0001
animal cage. (B) Distance traveled measured in the open field apparatus. and **P < 0.01 for time spent at the center versus the periphery and
Values are expressed as mean± standard error of the mean (WT, n = 13; ****P < 0.0001 for time spent in the open arm versus closed arm in wild-
HT, n = 9). WT animals: *P < 0.05 vs. day 01. HT animals: P < 0.05 vs. day type sedentary (WTS, n = 10), heterozygous sedentary (HTS, n = 10),
#
01. Repeated measures of two-way ANOVA were performed, followed by heterozygous exercise (HTE, n = 9), and wild-type exercise (WTE).
Tukey post-test. Abbreviation: ANOVA: Analysis of variance.
Abbreviations: WT: Wild-type; HT: Heterozygous; ANOVA: Analysis of
variance. 3.6. Voluntary physical exercise reduced S6
phosphorylation and increased total NR1
the dark chamber was measured in seconds (exposure expression in the frontal cortex of PTEN mice
+/-
session). After entering the dark compartment, the mice
received an electric foot shock (0.5 mA, 3 s in duration) To investigate the signaling pathways modulated by PTEN
through the grid floor. Once a mouse was shocked, it that might be altered in HT mice compared to WT mice
was immediately removed from the dark compartment in the presence or absence of voluntary running exercise,
and returned to its home cage. Twenty-four hours later, western blotting assay was performed on the frontal
the mouse was subjected to the test (probe session), and cortex (Figure 6J). The data were analyzed using a two-
the fear-motivated memory was measured by recording the way ANOVA followed by the Tukey multiple comparisons
latency to enter the dark compartment. test. The results revealed that female HTE mice presented
Data obtained from the inhibitory avoidance task were a reduction in the phospho-S6/S6 ratio compared to HTS
analyzed using the nonparametric Kruskal–Wallis test, mice (F[1,18] = 6.529, P = 0.0199 for treatment factor,
followed by post-test Dunn’s multiple comparison tests. P = 0.0208 for HTS vs. HTE) (Figure 6A). No significant
The results suggested an important variation between the differences were observed in the expressions of total S6
exposure and probe tests (P < 0.0001 and Kruskal–Wallis (genotype factor, F[1,19] = 1.063, P = 0.3154; treatment
test = 33.40). Post-test analysis indicated that all groups factor, F[1,19] = 0.3854, P = 0.5421; and interaction
remembered the aversive stimulus after 24 h (P = 0.0242 factor, F[1,19] = 1.185, P = 0.2900), synaptophysin
[
for WTS [exposure] vs. WTS [probe], P = 0.0368 for HTS (genotype factor, F 1,16] = 0.001934, P = 0.9655;
[exposure] vs. HTS [probe], P = 0.0034 for WTE [exposure] treatment factor, F[1,16]=0.06041, P = 0.8090; and
vs. WTE [probe], and P = 0.0366 for HTE [exposure] vs. interaction factor F[1,16] = 0.9265, P = 0.3501), or PTEN
HTE [probe]) (Figure 5). (genotype factor, F[1,19] = 0.2200, P = 0.6444; treatment
Volume 2 Issue 3 (2023) 6 https://doi.org/10.36922/an.0872