Page 98 - AN-2-3
P. 98

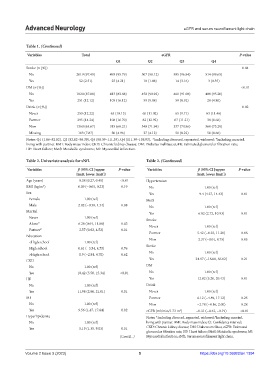
Advanced Neurology                                                 eGFR and serum neurofilament light chain


            Table 1. (Continued)
             Variables              Total                             eGFR                             P‑value
                                                  Q1            Q2           Q3            Q4
            Stroke (n [%])                                                                              0.04
             No                   2019 (97.49)  493 (95.79)  507 (98.12)   505 (96.84)  514 (99.65)
             Yes                   52 (2.51)     25 (4.21)    10 (1.88)     14 (3.16)     3 (0.35)
            DM (n [%])                                                                                  <0.01
             No                   1820 (87.88)  413 (83.88)  458 (90.92)   460 (91.08)  489 (95.20)
             Yes                  251 (12.12)   105 (16.12)   59 (9.08)     59 (8.92)    28 (4.80)
            Drink (n [%])                                                                               0.02
             Never                253 (12.22)   65 (10.13)    60 (11.02)    65 (9.71)    63 (11.46)
             Former               295 (14.24)   108 (16.70)   82 (12.92)   67 (11.21)    38 (6.60)
             Now                  1360 (65.67)  315 (68.21)  348 (71.94)   337 (70.86)  360 (73.29)
             Missing              163 (7.87)     30 (4.96)    27 (4.12)     50 (8.22)    56 (8.66)
            Notes: Q1 (1.86–82.82), Q2 (82.82–98.39), Q3 (98.39–111.39), Q4 (111.39–159.93).  *Including divorced, separated, widowed;  Including married,
                                                                                             #
            living with partner. BMI: Body mass index; CKD: Chronic kidney disease; DM: Diabetes mellitus; eGFR: Estimated glomerular filtration rate;
            HF: Heart failure; MetS: Metabolic syndrome; MI: Myocardial infarction.

            Table 2. Univariate analysis for sNfL              Table 2. (Continued)
             Variables            β (95% CI [upper   P‑value    Variables            β (95% CI [upper   P‑value
                                  limit, lower limit])                               limit, lower limit])
            Age (years)            0.38 (0.27, 0.49)  <0.01    Hypertension
            BMI (kg/m )           0.09 (−0.05, 0.23)  0.19      No                      1.00 (ref)
                   2
            Sex                                                 Yes                   9.4 (4.37, 14.43)  0.01
             Female                  1.00 (ref)                MetS
             Male                 2.02 (−0.30, 4.34)  0.08      No                      1.00 (ref)
            Marital                                             Yes                  6.82 (2.72, 10.93)  0.01
             Never                   1.00 (ref)                Smoke
             Alone*               6.26 (0.64, 11.88)  0.03      Never                   1.00 (ref)
             Partner #             2.57 (0.62, 4.52)  0.01
                                                                Former               5.42 (−0.35, 11.20)  0.06
            Education
             <High school            1.00 (ref)                 Now                  2.37 (−0.01, 4.75)  0.05
             High school          0.61 (−3.54, 4.75)  0.76     Stroke
             >High school          0.9 (−2.91, 4.70)  0.62      No                      1.00 (ref)
            CKD                                                 Yes                 24.97 (−16.08, 66.02)  0.21
             No                      1.00 (ref)                DM
             Yes                  10.42 (5.50, 15.34)  <0.01    No                      1.00 (ref)
            HF                                                  Yes                  12.82 (5.20, 20.43)  0.01
             No                      1.00 (ref)                Drink
             Yes                  11.98 (2.96, 21.01)  0.01     Never                   1.00 (ref)
            MI                                                  Former               6.12 (−4.89, 17.12)  0.25
             No                      1.00 (ref)                 Now                  −2.78 (−8.16, 2.60)  0.28
             Yes                  9.56 (1.47, 17.64)  0.02     eGFR (ml/min/1.73 m )  −0.31 (−0.42, −0.19)  <0.01
                                                                              2
            Hyperlipidemia                                     Notes: *Including divorced, separated, widowed;  Including married,
                                                                                             #
             No                      1.00 (ref)                living with partner. BMI: Body mass index; CI: Confidence interval;
             Yes                   5.19 (1.35, 9.03)  0.01     CKD: Chronic kidney disease; DM: Diabetes mellitus; eGFR: Estimated
                                                               glomerular filtration rate; HF: Heart failure; MetS: Metabolic syndrome; MI:
                                                    (Cont’d...)  Myocardial infarction; sNfL: Serum neurofilament light chain.


            Volume 2 Issue 3 (2023)                         5                         https://doi.org/10.36922/an.1394
   93   94   95   96   97   98   99   100   101   102   103